Hello! Welcome to the third lesson in our "AI for Business Decisions" module.
In our previous lessons, we defined AI by contrasting it with traditional software and then explored where AI can be applied across various business functions, using concrete examples within Power BI. You now have a solid foundation for explaining the what and the why of AI to the managers in your workshop.
Today, we address the logical next question: How does an AI project actually work? Our goal is to demystify the process by outlining the basic workflow of an AI project, from the initial business idea to a final, deployed solution. Understanding this lifecycle will provide a crucial roadmap for the managers, helping them see how each part of your workshop—from data cleaning to building dashboards—fits into a larger, coherent strategy.
The AI Project Lifecycle: A Structured Approach
An AI project isn't a mysterious, chaotic process. Like any well-managed business initiative, it follows a structured lifecycle. While the specific names of the stages can vary, the core ideas remain consistent. For your audience of managers, a project management-centric view is most effective.
This structure is crucial because it highlights that technology is only one part of the equation. A successful AI project starts with a clear business problem and ends with a solution that delivers measurable value.
The article below from the Project Management Institute (PMI) provides an excellent, industry-standard framework with six distinct phases. This methodology, called CPMAI (Cognitive Project Management for AI), is designed specifically for the realities of AI projects.
6 Phases to Run a Successful AI Project
To get a detailed, structured overview of a typical AI project, please read this short article from the Project Management Institute (PMI). It outlines a six-phase methodology that is highly relevant for managing data-driven projects.
Read the entire article, focusing on the descriptions of the six phases: Business understanding, Data understanding, Data preparation, Model development, Model evaluation, and Model operationalization. Also, note the final point about why iteration is important.
Let's break down these six phases in the context of the workshop you'll be teaching.

1. Phase 1: Business Understanding
- What it is: This is the most critical step. It's about defining the problem you want to solve and the goal you want to achieve. What business metric are you trying to improve? (e.g., reduce costs, increase sales, improve customer satisfaction). You also determine if AI is the right tool for the job.
- For your workshop: You'll be asking managers to think like this. A good prompt is: "What is a recurring question you wish you had a data-driven answer for?"
2. Phase 2: Data Understanding
- What it is: Once you know the problem, you look for the data. What data do you have? Is it accessible? Is it relevant? Does it contain the information needed to solve the problem? This phase is about exploration and assessment.
- For your workshop: This is where you'll introduce Power Query's ability to connect to data sources and preview the data, which allows for initial inspection.
3. Phase 3: Data Preparation
- What it is: This is often the most time-consuming part of an AI project. Data in the real world is messy. It has errors, missing values, and inconsistent formats. This phase involves cleaning, transforming, and structuring the data so the AI model can understand it. The saying "garbage in, garbage out" perfectly describes this stage.
- For your workshop: This is the core focus of your Power Query modules (Modules 4 and 5). You'll teach managers the essential skills of cleaning and preparing data without writing any code.
4. Phase 4: Model Development
- What it is: This is the "learning" phase. An algorithm is chosen and "trained" on the prepared data to find patterns or make predictions. In traditional AI projects, this involves complex coding and statistics.
- For your workshop: You will show how this phase is simplified in Power BI. It becomes as easy as clicking a button to add a forecast to a chart or using an AI visual like "Key Influencers." The manager isn't building the model from scratch; they are applying a pre-built, sophisticated model to their data.
5. Phase 5: Model Evaluation
- What it is: You've built a model, but is it any good? This phase tests the model's performance against the business goals defined in Phase 1. Does it predict accurately? Are the insights it provides useful and reliable?
- For your workshop: For a manager using Power BI, evaluation is about business sense. "Does this forecast look reasonable based on what I know about our sales cycle?" or "Do these 'Key Influencers' make logical sense?"
6. Phase 6: Model Operationalization (or Deployment)
- What it is: The model is put into action. It's integrated into a business process, a software application, or, most commonly for analytics, a dashboard that people can use to make decisions. The job isn't done after deployment; the model needs to be monitored to ensure it continues to perform well over time.
- For your workshop: The final Power BI report that managers build is the "operationalized" model. Publishing and sharing this dashboard is their version of deployment.
From Code-Centric to Data-Centric AI
The workflow above might sound like it requires a team of PhDs. Historically, that was true. However, the rise of tools like Power BI represents a fundamental shift in how AI is built—a shift from focusing on complex code to focusing on high-quality data.
Andrew Ng, a leading AI expert, explains this shift brilliantly. He argues that modern platforms empower subject-matter experts (like your managers) to build AI systems by focusing on what they know best: their data and their business context.
How AI Could Empower Any Business | Andrew Ng | TED
This clip from Andrew Ng's TED talk explains the crucial shift from code-centric to data-centric AI. This is the principle that makes no-code tools like Power BI so revolutionary for business users.
Watch the segment from 6:46 to 9:19. Notice how the quality inspector builds an AI system not by writing code, but by providing and labeling data. This perfectly illustrates the modern approach to the 'Data Preparation' and 'Model Development' phases.
As the video shows, the inspector's expertise is used to teach the AI by providing well-labeled examples. This is exactly what a manager will do in your workshop: they will use their business knowledge to clean and prepare data in Power Query, then use Power BI's AI features to automatically find patterns in that data.
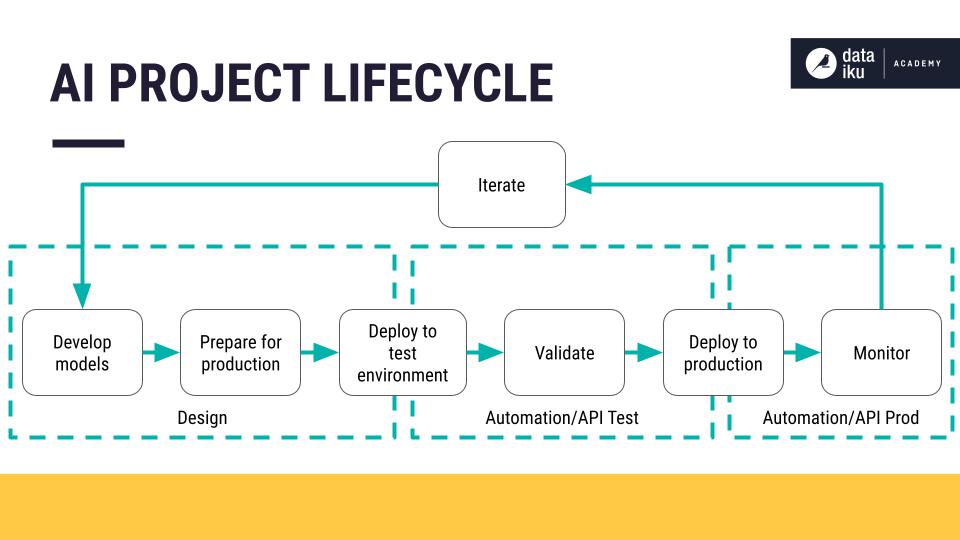
The Workflow is a Cycle, Not a Straight Line
It's vital to stress to your audience that this process is iterative. You don't just go through the six steps once and finish. You might get to the "Model Evaluation" phase and realize the results aren't good enough, which sends you back to "Data Preparation" to find more data or clean it differently. After deploying a dashboard, you might get feedback that requires you to go back to "Business Understanding" to refine the goals.
Test your understanding!
Here are several tasks involved in a project to predict customer churn. Arrange them in the correct order according to the 6-phase AI project workflow.
- Use Power Query to fill in missing values for "last purchase date" and remove duplicate customer entries.
- Define the project goal: "Reduce customer churn by 5% in the next quarter by identifying at-risk customers."
- Check if the model's predictions are accurate enough to be useful for the sales team.
- Examine the customer database to see what fields are available (e.g., purchase history, support ticket logs, customer tenure).
- Build an interactive Power BI dashboard that lists the top 100 customers most likely to churn, and share it with the sales team.
- Use the "Key Influencers" visual in Power BI to find the factors that are most correlated with a customer churning.
Show answer
The correct order is:
- 2. Define the project goal... (Phase 1: Business Understanding)
- 4. Examine the customer database... (Phase 2: Data Understanding)
- 1. Use Power Query to fill in missing values... (Phase 3: Data Preparation)
- 6. Use the "Key Influencers" visual... (Phase 4: Model Development)
- 3. Check if the model's predictions are accurate... (Phase 5: Model Evaluation)
- 5. Build an interactive Power BI dashboard... (Phase 6: Model Operationalization)
Conclusion
In this lesson, you've gained a structured framework for explaining how an AI project works from beginning to end. This high-level map is essential for providing context before diving into hands-on tool training.
Key Takeaways:
- Successful AI projects follow a structured, six-phase lifecycle: Business Understanding, Data Understanding, Data Preparation, Model Development, Model Evaluation, and Operationalization.
- The most time-consuming and critical phase is often Data Preparation—hence the focus on Power Query in your workshop.
- Modern, no-code tools like Power BI democratize AI by shifting the focus from writing complex code to providing high-quality, well-prepared data.
- The AI project lifecycle is iterative, not linear. It’s a continuous cycle of building, testing, deploying, and refining.
Preview of the Next Lesson:
With this workflow as our guide, we are ready to begin our practical journey. The first step in any data project is getting the data. In the next module, we will launch Power Query for the first time and tackle the first task in the "Data Understanding" phase: importing data from common sources like Excel and CSV files.