Hello! Welcome back to your second lesson.
In our first session, we established the core difference between AI and traditional software: AI learns from data, while traditional software follows pre-programmed rules. This distinction is the foundation for everything that follows.
Today, we'll build on that foundation to address your next learning outcome: identifying common AI applications relevant to business operations. We'll move from the abstract "what is AI?" to the practical "where can we use it?". This lesson is designed to provide you with a portfolio of real-world examples that you can use in your workshop to make AI tangible and relevant for the managers you'll be teaching. We will connect these applications directly to the capabilities within Power BI, setting the stage for the hands-on sections of your course.
1. A Framework for Identifying AI Opportunities
When introducing AI applications, it's helpful to start with a strategic framework. This helps managers think about where AI can create value in a structured way, rather than just listing random examples.
A useful model is to consider four key areas of business transformation. AI can be applied to create opportunities in each one.
Integrating Generative AI Into Business Strategy: Dr. George Westerman
Dr. George Westerman from MIT provides a clear, management-focused framework for digital transformation opportunities. This will help you structure the conversation around business value, not just technology.
Watch the segment from 8:13 to 10:04. Dr. Westerman outlines four areas where technology, including AI, can create opportunities. Note these down as categories for organizing AI use cases.
As the video explains, you can frame AI applications within these four domains:
- Enhancing Customer Experience: Making interactions more personalized, engaging, and efficient.
- Example: An AI-powered chatbot that can handle complex customer queries 24/7, not just follow a simple script.
- Optimizing Operations: Improving internal processes to make them faster, more adaptable, and less costly.
- Example: A system that predicts machinery failure on a factory floor before it happens (predictive maintenance).
- Developing New Business Models: Using information to create new products, services, or revenue streams.
- Example: An insurance company offering usage-based premiums by analyzing driving data from a mobile app.
- Improving Employee Experience: Augmenting employees' capabilities and automating tedious tasks to free them up for more strategic work.
- Example: A tool that listens to sales calls and provides real-time coaching hints to the salesperson.
Using this framework in your workshop will allow you to ask managers: "In which of these areas is your team facing the biggest challenges?" This immediately makes the discussion about solving their problems, not just implementing new tech.
2. Concrete AI Applications Across Business Functions
Now let's zoom in from the strategic framework to specific, functional examples. Many managers will want to know, "What can AI do for my department?"
The following video by Andrew Ng, a leading figure in AI, provides excellent, relatable examples for small and medium-sized businesses, proving that AI isn't just for large tech companies.
How AI Could Empower Any Business | Andrew Ng | TED
This TED talk by Andrew Ng demonstrates how AI can be applied to everyday business problems, from a local pizza shop to a T-shirt company. These examples are perfect for demystifying AI and making it accessible to your audience.
Watch from 2:03 to 5:19. Pay close attention to the specific examples for the pizza store and the T-shirt company. Note how AI is applied to different functions like demand forecasting, supply chain, and quality control.
Here is a summary of common applications, organized by the business functions your managers will recognize:
-
Sales & Marketing:
- Demand Forecasting: Predicting which products will be popular and when (like the pizza and T-shirt examples from the video).
- Customer Churn Prediction: Identifying customers who are at risk of leaving so that proactive measures can be taken.
- Personalized Recommendations: Suggesting products or services to customers based on their past behavior (the engine behind Amazon and Netflix).
-
Operations & Manufacturing:
- Quality Control: Automatically inspecting products for defects using cameras and computer vision (like the fabric inspector example).
- Predictive Maintenance: Analyzing sensor data from equipment to predict failures before they occur, reducing downtime.
- Supply Chain & Inventory Optimization: Forecasting demand to prevent stockouts or overstocking and optimizing delivery routes.
-
Finance:
- Fraud Detection: Identifying unusual transaction patterns that may indicate fraudulent activity, as seen with companies like PayPal.
- Automated Expense Reporting: Using AI to read receipts and automatically categorize expenses.
-
Human Resources:
- Resume Screening: Automatically scanning and shortlisting candidates whose resumes best match a job description.
- Employee Sentiment Analysis: Analyzing internal survey responses or communications to gauge workforce morale.
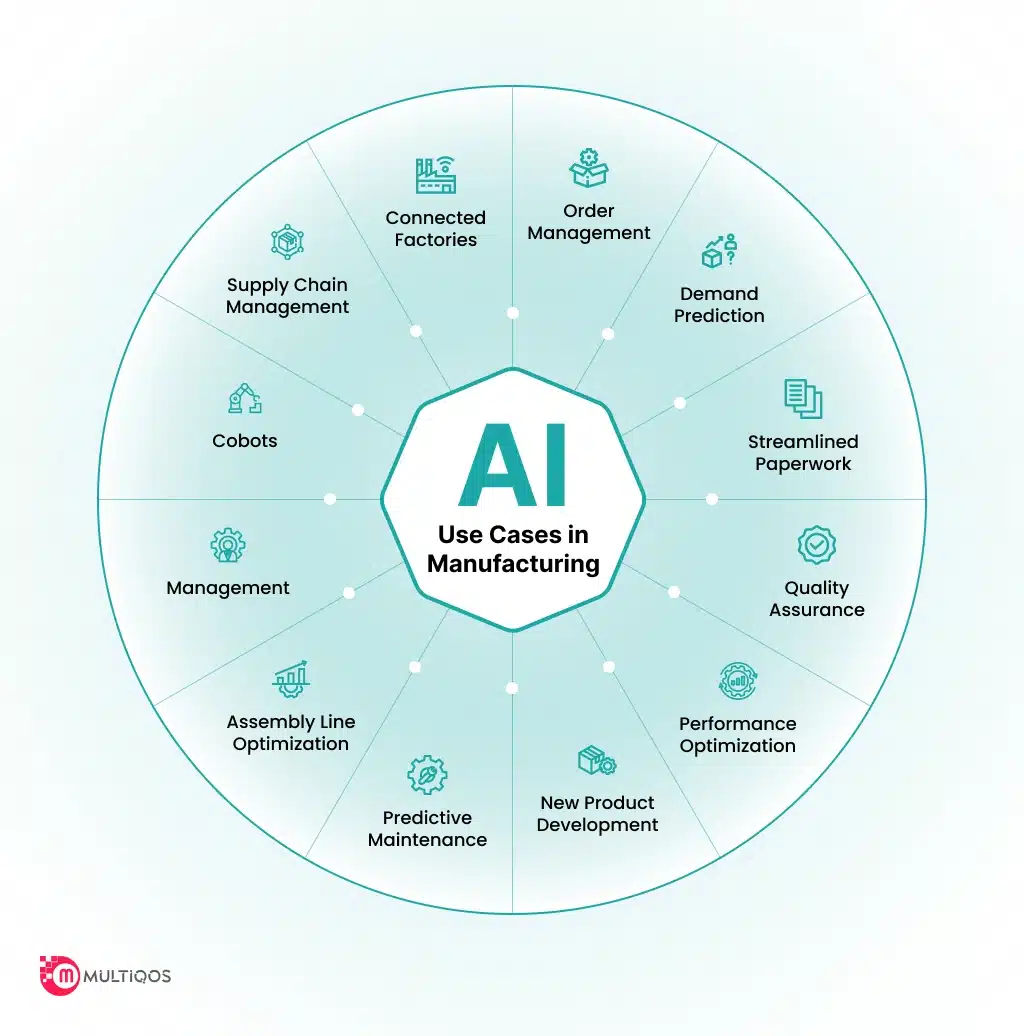
This image provides a great visual summary of AI applications within a single industry—manufacturing—which can help your audience visualize the breadth of possibilities.
3. AI in Your Hands: Applications in Power BI
This is the most crucial part of the lesson for your workshop. Here, you connect the abstract concepts to the no-code tool your audience will be using. You can show them that they don't need a team of data scientists to start using AI; many powerful applications are built directly into Power BI.
The article below provides a fantastic overview of AI use cases within Power BI.
AI in Power BI: Top Use Cases You Need To Know
The article 'AI in Power BI: Top Use Cases You Need To Know' is a practical guide that links AI capabilities directly to business benefits and provides real-world examples. It's a perfect resource to prepare for the hands-on portion of your workshop.
Read the sections 'Business Benefits of AI in Power BI' and 'Specific Applications of AI in Power BI'. Focus on how features like 'Key Influencers', 'Q&A', and 'Anomaly Detection' solve specific business problems.
Here is a map of the key AI features available in Power BI that you can introduce in your workshop.
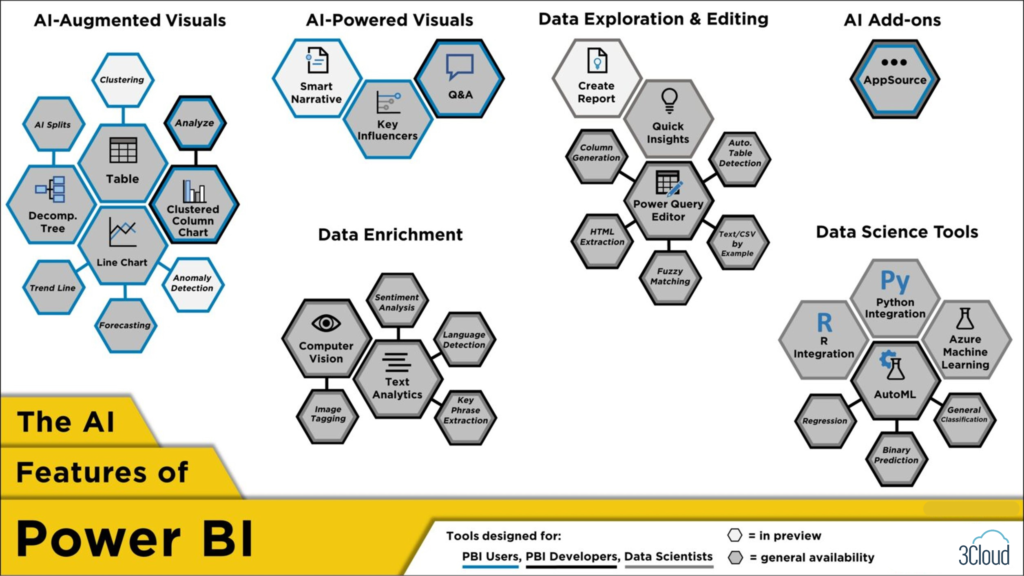
Let's focus on a few of the most accessible and impactful features that you will cover in more detail later in the workshop. The Microsoft Learn article, "Artificial Intelligence sample for Power BI," provides a guided tour of these features in action.
1. Root Cause Analysis (Answering "Why?")
- Business Problem: A manager sees that sales have dropped, but doesn't know why. Is it a specific product, region, or salesperson?
- AI Application: The Key Influencers and Decomposition Tree visuals. These tools analyze your data to find the statistical drivers behind an outcome.
- In Practice: Instead of manually slicing data, a manager can use the Key Influencers visual to see that, for example, "when the discount is over 20%, sales are 3x more likely to be won." The Decomposition Tree lets them drill down into this to find the root cause.
2. Anomaly Detection (Finding the Unexpected)
- Business Problem: A sudden, unexpected spike or dip occurs in a key metric (e.g., website traffic, daily revenue). Manually finding the cause in a huge dataset is like finding a needle in a haystack.
- AI Application: The Anomaly Detection feature in line charts.
- In Practice: Power BI automatically flags data points that fall outside the expected range and can even provide possible explanations by analyzing other factors in your data that correlate with the anomaly.
3. Natural Language Querying (Asking Questions in Plain English)
- Business Problem: A non-technical manager needs a quick answer from the data but doesn't know how to build a chart or use filters. They have to ask an analyst and wait.
- AI Application: The Q&A (Question & Answer) feature.
- In Practice: The manager can simply type a question like, "show me the top 5 products by revenue in the west region last quarter," and Power BI will generate the appropriate visual on the fly. This democratizes access to data insights.
4. Forecasting (Predicting the Future)
- Business Problem: A manager needs to plan inventory and staffing for the next quarter. They rely on guesswork or simple trend lines.
- AI Application: The Forecasting feature in line charts.
- In Practice: With one click, Power BI can apply statistical models to your time-series data to project future trends, complete with confidence intervals to show the range of likely outcomes.
Test your understanding!
Imagine you're coaching a supply chain manager who is new to Power BI. They have a dataset with historical sales data, product categories, shipping times, and warehouse locations. Match their business questions to the most appropriate AI feature in Power BI.
| Business Question | AI Feature in Power BI |
|---|---|
| 1. "My shipping delays suddenly spiked last week. What happened?" | A. Forecasting |
| 2. "I just want to know the total sales for 'Product X' in Germany. Can I just ask?" | B. Key Influencers / Decomposition Tree |
| 3. "What will our sales likely be for the next three months?" | C. Anomaly Detection |
| 4. "What are the main factors that contribute to our products being delivered on time?" | D. Natural Language Q&A |
Show answer
- C. Anomaly Detection: The term "suddenly spiked" is a key indicator of an anomaly. This feature is designed to flag and help explain such unexpected events.
- D. Natural Language Q&A: This is a straightforward factual question, perfect for the Q&A feature, which allows users to ask questions in plain language.
- A. Forecasting: The question asks for a future projection ("next three months"), which is the exact purpose of the forecasting tool.
- B. Key Influencers / Decomposition Tree: This question asks to identify the "main factors" driving an outcome (on-time delivery). This is a classic root cause analysis problem, perfectly suited for the Key Influencers visual.
Conclusion
In this lesson, we moved from theory to practice by identifying a wide range of AI applications in business. You are now equipped to show the managers in your workshop not only what AI is, but what it does.
Key Takeaways:
- AI applications can be found across all major business functions, from customer experience and operations to finance and HR.
- The value of AI is not limited to tech giants; even small and medium-sized businesses can leverage it to solve practical problems like demand forecasting and quality control.
- Modern business intelligence tools like Power BI have embedded powerful, no-code AI features (like Anomaly Detection, Key Influencers, and Q&A) that make AI accessible to non-technical users.
Preview of the Next Lesson:
We've answered the "what" and the "where." The next logical question is "how?". In the next lesson, "Describe the basic workflow of an AI project from data to deployment," we will outline the typical steps involved in taking a business problem and solving it with a data-driven approach. This will provide a mental map for your audience before they dive into the first hands-on step: getting and cleaning data in Power Query.