Hello! Welcome to the next lesson in our module on "Sharing Insights and Collaboration."
In the last lesson, you learned how to create a Power BI dashboard by pinning key visuals, transforming a detailed report into a high-level executive summary. That dashboard is a powerful tool, but right now, it's only visible to you. The true value of data analysis is realized when insights are shared with the right people to drive decisions.
This lesson directly addresses the learning outcome: Share a dashboard with colleagues and manage user access levels. We will cover the different methods for sharing your work in the Power BI Service, from sending a direct link to collaborating in a shared workspace. A key focus will be on managing permissions to ensure that the right people have the right level of access, which is a critical aspect of data governance that the managers in your workshop must understand.
Why Sharing and Permissions Matter
Before diving into the "how," it's useful to frame the "why" for your workshop audience. A dashboard is not just a static picture; it's a gateway to live data. Sharing it effectively means:
- Empowering Decision-Makers: Getting timely insights to the people who need them.
- Ensuring Data Security: Controlling who can see sensitive information.
- Facilitating Collaboration: Allowing team members to build upon existing work.
The Direct Approach: Sharing a Report or Dashboard
The most straightforward way to share your work is by sending a link directly from the Power BI Service. This is ideal for ad-hoc sharing or when you want to send a specific report or dashboard to a few individuals.
Let's watch a video that demonstrates this core sharing process.
BEGINNERS GUIDE to SHARING REPORTS in Power BI // Generate Links, Manage Access and Permissions
This video from the Fernan | Power BI channel provides a clear, step-by-step walkthrough of the sharing process. Pay close attention to the different link types and permission options available.
Watch from 00:37 to 03:37. The video covers how to open the 'Share' dialog, send a link to specific people, and customize the link's permissions (e.g., allowing others to re-share).
As you saw, the Share dialog is the central hub for this process. Here's a summary of the key options you'll need to explain in your workshop:
-
Who can use the link?
- Specific people: The most secure option. Only the people you list can use the link. This is best for sharing sensitive data with a defined group.
- People in your organization: Anyone within your company who gets the link can view the content. Use this for less sensitive data that is broadly applicable.
- People with existing access: This just sends a convenient link to people who already have permission through a workspace role (we'll cover this next).
-
What can they do with it?
- Allow recipients to share: If checked, the people you share with can then share it with others. For security, it's often best to leave this unchecked unless you want the report to be distributed widely.
- Allow recipients to build content: This is a powerful option. It grants users "Build permission," meaning they can connect to your underlying dataset to create their own reports and visuals. This is excellent for enabling self-service analytics but should be granted thoughtfully.
Managing Who Has Access
Sharing content isn't a one-time event. You need to be able to review and manage who has access over time. The Manage permissions pane is where you control this.
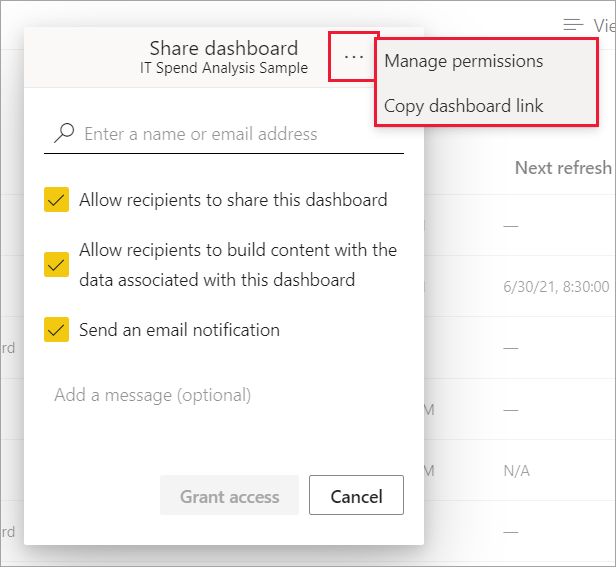
The following video segment explains how to use this pane to see the links you've created and grant direct access.
BEGINNERS GUIDE to SHARING REPORTS in Power BI // Generate Links, Manage Access and Permissions
Let's continue with the same video to see how to manage the links you've generated and grant direct access to users.
Watch from 03:37 to 05:09. The presenter shows how to find the 'Manage permissions' pane and explains the difference between access via links and 'Direct access'.
Key Takeaway for Your Workshop:
- Links vs. Direct Access: You can create multiple shareable links with different permissions. You can also grant direct access to users, which doesn't rely on a specific link. The "Manage permissions" pane lets you control both.
- Pending Requests: This pane is also where you would approve or deny requests from users who try to access the report without permission.
Test your understanding!
A manager wants to share a sales dashboard with her direct team of five people. She wants them to be able to view it, but not share it with anyone else. She also wants to share the same dashboard with the head of the marketing department, and allow them to build their own reports using the sales data.
How could she use the sharing options to accomplish both goals?
Show answer
She would use the "Share" feature twice to create two different links:
- For her team: She would select "Specific people," enter the five email addresses of her team members, and ensure both the "Allow recipients to share" and "Allow recipients to build content" boxes are unchecked.
- For the marketing head: She would again select "Specific people," enter the marketing head's email address, uncheck "Allow recipients to share," but this time check the box for "Allow recipients to build content with the data..."
This creates two distinct access levels for two different audiences for the same dashboard.
Collaboration at Scale: Workspace Roles
Sharing individual items is great for specific tasks, but for ongoing team collaboration, Power BI Workspaces are the standard. A workspace is a shared environment where a team can create, edit, and distribute content together. Access is managed through a set of predefined roles.
This is a fundamental concept for managers to grasp, as it's how they will structure their team's analytics environment.
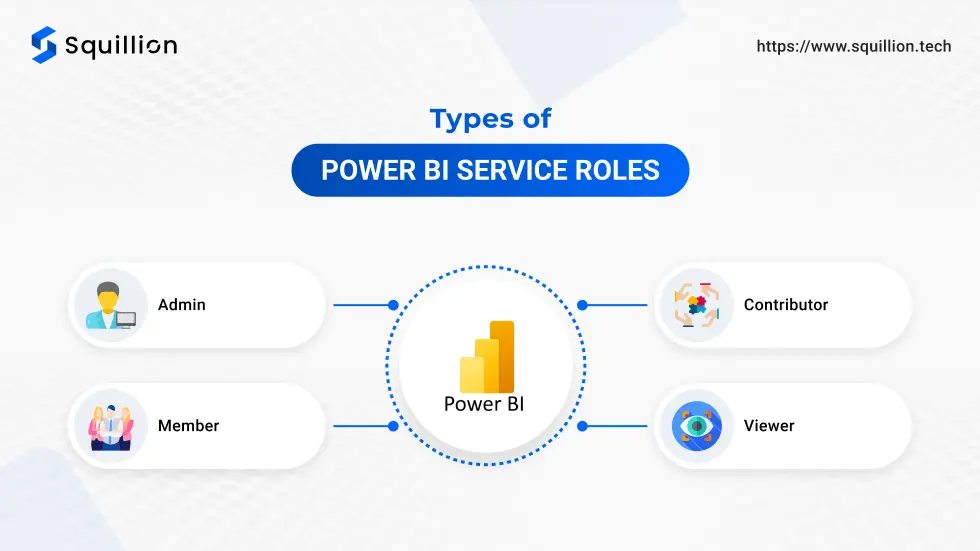
The four roles provide different levels of permission:
- Admin: Full control. Can manage the workspace, add/remove users (including other admins), and publish apps.
- Member: Can do almost everything an Admin can, except delete the workspace or modify user access at the Admin level. They can add other Members, Contributors, or Viewers.
- Contributor: The "content creator" role. Can create, edit, and delete reports and dashboards within the workspace but cannot manage users or publish the app.
- Viewer: Read-only access. Can view and interact with content but cannot change anything.
To prepare for your workshop, you need to understand the specific capabilities of each role. The official Microsoft documentation provides the definitive guide.
Roles in workspaces in Power BI
Please study the 'Workspace roles' table in this Microsoft Learn article. This table is the most important resource for understanding exactly what each role can and cannot do. It will be an invaluable reference for your workshop.
Focus on the large table under the 'Workspace roles' heading. Compare the capabilities of Admin, Member, Contributor, and Viewer. Pay special attention to permissions related to publishing, sharing, and editing content.
A Note on Licensing
A practical question that will always come up in your workshop is about cost and licenses. For non-technical managers, keep the explanation simple.
- To share content or to view content that has been shared with you, you generally need a Power BI Pro license.
- The main exception is if your company has Power BI Premium Capacity. In that case, users with a Free license can view content that is stored in that premium capacity.
This is a simplified view, but it's the core message your audience needs. You can find more details in the "Prerequisites" section of the Microsoft documentation on sharing (LINK).
Conclusion
You now have a comprehensive understanding of how to share Power BI content and manage who has access to it. This is a crucial skill for turning data insights into collaborative action.
Key Takeaways for Your Workshop:
- You can share reports and dashboards directly using the Share button, with granular control over who can access the link and what they can do.
- The Manage Permissions pane is the central hub for reviewing access, revoking permissions, and approving requests.
- For team collaboration, Workspaces are the primary tool, with access controlled by four distinct roles: Admin, Member, Contributor, and Viewer.
- Licensing is a practical consideration: a Power BI Pro license is typically required for both sharing and viewing shared content.
Preview of the Next Lesson:
You've built a dashboard and shared it with your team. But what happens when the underlying data changes next week? The dashboard will become outdated. In our next and final lesson of this module, "Explain the purpose and benefits of scheduling a data refresh," you will learn how to automate this process to ensure your reports and dashboards are always displaying the most current information.