Hello! Welcome to the next lesson in our "Sharing Insights and Collaboration" module.
In our last session, you learned how to publish a Power BI report from your Desktop application to the Power BI Service, making it accessible in the cloud. This was the essential first step in sharing your work. However, a multi-page, detailed report might not be the best way to present key information to a busy manager or executive. They often need a high-level summary—a single pane of glass showing the most critical metrics.
This lesson directly addresses that need and covers the learning outcome: Create a dashboard by pinning key visuals from published reports. We will explore the crucial difference between a Power BI Report and a Dashboard, and then you'll learn the hands-on process of creating a dashboard by selecting and "pinning" the most important visuals from your published reports. This is a core skill for the managers in your workshop, as it allows them to create compelling, at-a-glance summaries for leadership.
Report vs. Dashboard: What's the Difference?
Before we create a dashboard, it's vital to understand how it differs from a report. This is a frequent point of confusion, and clarifying it will be key for your workshop audience.
- Report: A multi-page, interactive canvas for deep analysis. You build reports in Power BI Desktop. Users can slice, dice, and cross-filter data to explore it in detail. Think of it as the complete, in-depth research document.
- Dashboard: A single-page, high-level overview that consolidates key metrics. You can only create dashboards in the Power BI Service. It's designed for monitoring and provides a quick summary. Think of it as the executive summary on the front page of that research document.
The image below visually contrasts these two concepts. A dashboard is a collection of key visuals on one screen, while reports are the detailed, multi-page documents where those visuals originate.

To get a clear explanation of these differences, let's watch the beginning of a helpful video.
Report or Dashboard in Power BI
This video from Pragmatic Works does an excellent job of explaining the distinct purposes and functionalities of reports versus dashboards in Power BI. Pay close attention to the discussion of interactivity.
Watch from the beginning to 06:22. The presenter clearly explains that reports are for in-depth, interactive analysis, while dashboards are high-level, static overviews where clicking a visual links you back to the report.
The key takeaway is that visuals on a dashboard are not interactive with each other (no cross-filtering). Instead, each visual—called a tile—acts as a link back to the original report, allowing users to drill down for more detail if needed.
Creating a Dashboard: Pinning Your Key Visuals
Now that you understand the concept, let's walk through the process of creating a dashboard. The fundamental action is pinning, which is like taking a snapshot of a visual from a report and pinning it onto your dashboard canvas.
The entire process happens in the Power BI Service, starting with the report you published in the last lesson.
Step-by-Step Guide to Pinning Visuals
The Microsoft Learn documentation provides an excellent, concise tutorial on this process. We will follow its steps, and I will provide additional context for you.
Tutorial: Get Started Creating in the Power BI Service
Please read through this section of the Microsoft Learn tutorial. It walks you through pinning your first visual to a new dashboard.
Read the section titled 'Pin a report visual to a dashboard'. This shows you how to hover over a visual, click the pin icon, and create a new dashboard. This is the core skill for this lesson.
To summarize and visualize this process:
- Open your Report in the Power BI Service workspace.
- Hover over a Visual you want to include in your dashboard. Several icons will appear.
- Click the Pin Icon (it looks like a pushpin).
- In the "Pin to dashboard" dialog box, select "New dashboard".
- Give your dashboard a name (e.g., "Executive Sales Summary").
- Click "Pin".
You'll get a confirmation message, and you can either go to the dashboard or continue pinning more visuals.
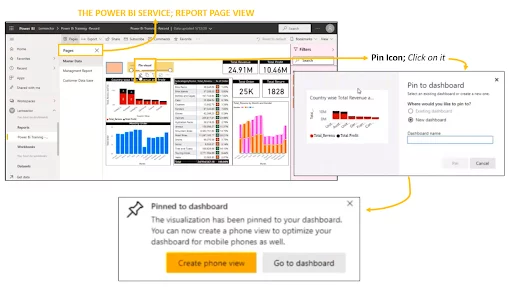
Populating Your Dashboard
A dashboard becomes truly powerful when it consolidates visuals from multiple sources. You can go back to your report and pin more visuals. You can even open a completely different report (in the same workspace) and pin visuals from it to the same dashboard. This allows you to create a central hub for monitoring KPIs that might span different departments or projects.
The following video demonstrates this entire flow, from pinning the first visual to building out a simple dashboard.
Report or Dashboard in Power BI
Let's see this process in action. This part of the Pragmatic Works video provides a clear, step-by-step demonstration of pinning several visuals to create a new dashboard.
Watch from 08:22 to 11:00. Observe how the presenter selects different visuals, pins them to a new dashboard, and then navigates to the workspace to show the newly created dashboard as a separate item from the report.
Test your understanding!
A manager in your workshop wants to create a single-page view for the CEO. This view needs to show three critical KPIs:
- Total Sales (from the Sales Report)
- On-Time Deliveries (from the Logistics Report)
- Customer Satisfaction Score (from the Support Report)
When the CEO clicks on any KPI, they need to be taken to the full, detailed report for more information. Should the manager create a new Power BI report or a Power BI dashboard to achieve this?
Show answer
The manager should create a Power BI dashboard. Dashboards are ideal for this scenario because they are designed to consolidate key visuals (tiles) from multiple different reports onto a single page. Furthermore, the default behavior of a dashboard tile is to act as a link back to its source report, providing the exact drill-down functionality the CEO needs.
Customizing and Interacting with Your Dashboard
Once you've pinned your tiles, you can arrange them to create a clean and logical layout. In the dashboard view, you can:
- Resize and Reposition Tiles: Click and drag tiles to move them, and drag their corners to resize them. The tiles will snap to a grid, helping you keep the layout tidy.
- Edit Tile Details: Click the ellipsis (...) on a tile to edit details like its title or add a subtitle. This is useful for providing more context.
- Drill Through to Reports: The primary interaction on a dashboard is clicking a tile. As mentioned, this will take you directly to the source report page where that visual came from, allowing for deeper investigation.
For a walkthrough of these customization options, refer to the following guide.
Tutorial: Get Started Creating in the Power BI Service
This section of the Microsoft Learn tutorial covers the basic but essential tasks of arranging your dashboard for better presentation.
Read the sections 'Adjust tile layout on the dashboard' and 'Modify tile details'. This will show you how to resize, move, and rename your dashboard tiles.
An Important Note on Filters
When you pin a visual from a report, the dashboard tile will respect any filters applied to that visual at the time of pinning. For example, if you filter your report to show only sales for "Germany" and then pin the sales chart, the tile on the dashboard will permanently show sales for Germany.
Dashboards and Reports? What's the Difference? // Beginners Guide to Power BI in 2021
This short video provides a great example of how filter context is preserved when you pin a visual.
Watch from 01:32 to 03:19. Notice how the presenter pins a sales visual filtered by year and country, and the resulting dashboard tile reflects that specific filter. This is a subtle but very important concept for your workshop participants to grasp.
Conclusion
In this lesson, you've bridged the gap between a detailed analytical report and a high-level executive summary. You now have the knowledge to teach your workshop participants how to create a compelling Power BI dashboard.
Key Takeaways for Your Workshop:
- Dashboards are for monitoring, Reports are for exploring. Use the "executive summary vs. research paper" analogy.
- Dashboards are created in the Power BI Service by pinning visuals from one or more published reports.
- Dashboard tiles are static but serve as gateways back to the detailed, interactive reports.
- The layout of a dashboard can be easily customized by resizing and rearranging tiles.
Preview of the Next Lesson:
Creating a dashboard is a huge step, but it's still only visible to you in your workspace. The real value comes from sharing it with decision-makers. In our next lesson, "Share a dashboard with colleagues and manage user access levels," you will learn how to securely distribute your dashboard and control who can view it.