Hello! Welcome to the final lesson in our "Forecasting and Predictive Insights" module.
In our last session, you learned the practical steps for applying a forecast to time-series data in Power BI. We focused on configuring the key parameters like forecast length and seasonality. You are now able to generate a predictive chart.
Today, we will address the crucial next step: interpreting what the forecast is telling us. This lesson is designed to help you meet the learning outcome: Interpret forecast results, including confidence intervals and their limitations. Moving beyond simply creating the forecast, you will learn to critically evaluate its output. This is a vital skill to pass on to your workshop participants, as it empowers them to use AI tools as discerning decision-makers, not just passive consumers of information.
Deconstructing the Forecast: More Than Just a Line
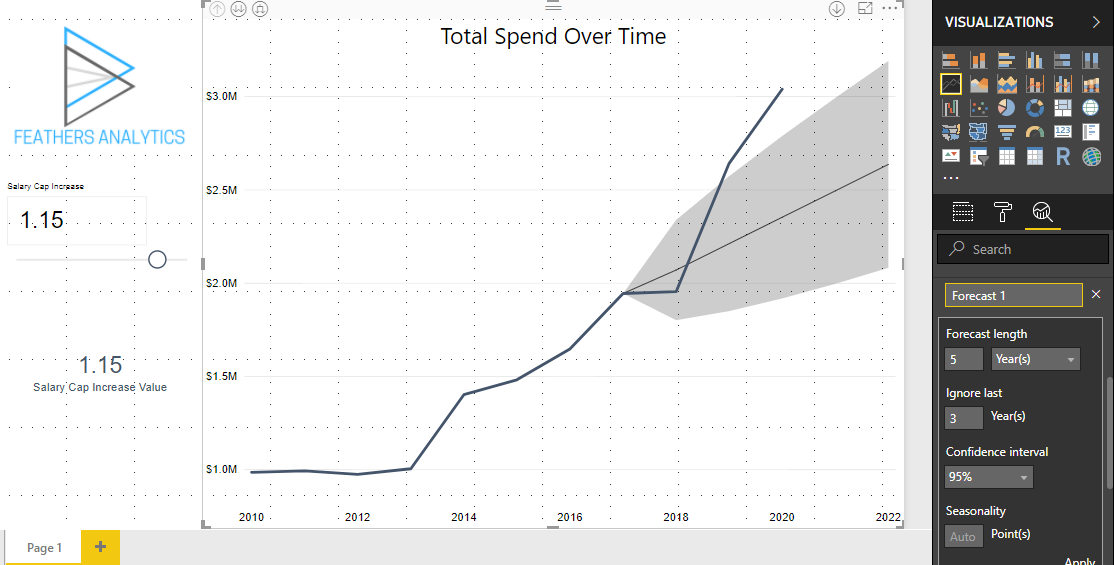
When Power BI generates a forecast, it adds more than just a single projected line to your chart. It provides a range of possibilities. Understanding this range is the first step to correct interpretation.
The forecast output consists of three main components:
- The Forecast Line: This dotted line represents the model's single best guess, or the most probable value, for future data points.
- The Upper Bound: This is the top edge of the shaded area. It represents the optimistic scenario.
- The Lower Bound: This is the bottom edge of the shaded area. It represents the conservative scenario.
The shaded area between the upper and lower bounds is the confidence interval.

To get a precise definition of these bounds, let's turn to a clear explanation.
The article 'Forecast Analysis in Power BI' provides concise definitions for the upper and lower bounds. This will help you explain these concepts clearly in your workshop.
Read the two bullet points under the heading 'when performing forecasting analysis...'. The first two points define 'Upper Bound' and 'Lower Bound'. Focus on how they represent the limits of uncertainty.
Understanding Confidence Intervals: Quantifying Uncertainty
The confidence interval is arguably the most important—and often misunderstood—part of a forecast. It visually represents the level of uncertainty in the prediction.
A simple analogy for your workshop: A confidence interval is like a weather report that gives a high and low temperature for the day, not just a single number. It provides a probable range.
A 95% confidence interval (the default in Power BI) means that the model is 95% confident that the actual future value will fall somewhere within that shaded range. It does not mean the forecast is 95% accurate.
The width of this band is a direct indicator of certainty:
- A narrow band suggests the historical data is stable and predictable, so the model is more confident.
- A wide band suggests the data is volatile or sparse, so the model is less certain about the future.
Let's watch a video that demonstrates this concept. While it uses Excel, the principles of confidence intervals and how the confidence level setting impacts the range are identical in Power BI and are explained very clearly.
Forecasting in Excel: MUST-KNOW for Any Analyst
This video from Kenji Explains, 'Forecasting in Excel', gives an excellent conceptual breakdown of confidence intervals.
Watch from 05:30 to 07:48. Pay close attention to: The explanation of what the confidence interval number means (a range around the forecast). How the upper and lower bounds are created. What happens to the width of the range when the confidence level is changed from 95% to 99%, and then to 90%. This is key to understanding the trade-off between confidence and precision.
Test your understanding!
Look at the image line-chart-forecasting.png again. The tooltip for June 25, 2025, shows a forecast of 15,620 and a lower bound of -1,630. Assuming this is a sales forecast, what does the negative lower bound tell you about the forecasting model's limitations?
Show answer
The negative lower bound highlights a key limitation: the statistical model does not understand business context. It's simply extrapolating a mathematical pattern from the historical data's volatility. It doesn't know that sales cannot be negative. This is a perfect example to use in your workshop to emphasize that AI-generated forecasts require human interpretation and common sense.
The Critical Part: Acknowledging the Limitations
For a manager, the most important lesson is that a forecast is not a crystal ball. To use this tool responsibly, they must understand its limitations. Your role as an instructor is to instill a healthy sense of skepticism and critical thinking.
Power BI's forecasting is powerful because it's easy, but that ease of use comes with trade-offs.
This article, 'Forecast Analysis in Power BI', provides a fantastic, ready-to-use list of the limitations of Power BI's forecasting feature. This is essential content for your workshop.
Read the section 'Limitations of Forecasting in Power BI'. You will use these points directly in your workshop to teach managers about the boundaries of the tool. Pay attention to all six points, especially the reliance on past data and the fact that confidence intervals are not guarantees.
To summarize the key limitations for your workshop audience:
- It Only Knows the Past: The model assumes future patterns will resemble past patterns. It cannot predict the impact of unforeseen events like new competitors, marketing campaigns, or economic shifts.
- Garbage In, Garbage Out: As we've discussed before, the forecast is only as reliable as the data you feed it. Inaccurate or incomplete historical data will lead to a flawed forecast.
- Confidence is Not a Guarantee: There is always a statistical chance (e.g., 5% for a 95% confidence interval) that the actual results will fall outside the forecasted range.
- It's a "Black Box": Power BI uses a standard statistical method (Exponential Smoothing or ETS), but it doesn't allow for the deep customization that a data scientist might perform with specialized software.
The single most important mistake to warn managers against is treating the forecast as a certainty.
Conclusion
In this lesson, you've moved from creating a forecast to interpreting one. You are now prepared to teach managers how to read a forecast chart, understand the critical concept of a confidence interval as a measure of uncertainty, and appreciate the inherent limitations of this automated tool.
Key Takeaways for Your Workshop:
- A Forecast is a Range: Emphasize that managers should look at the upper bound (optimistic), lower bound (conservative), and the forecast line (most likely) to understand the range of plausible futures.
- The Confidence Interval is Key: Teach them that the width of the shaded band is a visual cue for certainty. A wider band demands more caution.
- Human Judgment is Irreplaceable: A forecast is a data-driven input, but it must be combined with business knowledge and expertise. Encourage managers to ask "what does the forecast not know?"
- Promote Critical Thinking: Frame the forecast as a tool that helps ask better questions, not one that gives all the answers.
Preview of the Next Module:
You have now completed the modules on data cleaning, transformation, visualization, and AI-powered analytics. Your workshop participants have learned to turn raw data into insightful reports and predictions. The next logical step is sharing those insights. In the upcoming module, "Sharing Insights and Collaboration," you will learn how to publish reports to the Power BI service, create dashboards, and manage access so that the entire team can benefit from this data-driven work.