Hello! Welcome back to our module on "Forecasting and Predictive Insights."
In the previous lesson, we established the "what" and "why" of forecasting, framing it as a crucial tool for managers to move from reacting to past events to proactively planning for the future. You learned how to position forecasting within the broader analytics landscape and identify compelling business use cases.
Now, we shift from theory to practice. This lesson is designed to give you the hands-on skills to meet the learning outcome: Apply built-in forecasting to time-series data in Power BI. We will walk through the exact steps to create a forecast using Power BI's no-code features. This is a core practical skill you will teach your workshop participants, allowing them to turn their historical data into forward-looking insights.
Preparing for a Forecast: The Prerequisites
Before you can generate a forecast in Power BI, you need two things in place. This is a critical point to emphasize in your workshop, as it connects directly to the data preparation work the managers will have already learned.
- Clean, Time-Series Data: The forecasting model needs data that is structured over time. This means having a date or time column and a numeric value column (e.g., sales, units, costs). As the article "How to Use Power BI for Forecasting" highlights, the quality of your forecast depends entirely on the quality of your data.
- A Line Chart Visual: The built-in forecasting feature in Power BI is specifically designed to work with line charts. It will not be available for other visual types like bar charts or pie charts.
Let's begin by building the foundational line chart that a forecast is built upon.
Time Series Forecasting in Power BI
This short clip from the video 'Time Series Forecasting in Power BI' by Anthony Smoak demonstrates how to create the simple line chart that is the starting point for any forecast.
Watch from 00:11 to 00:53. Notice how a date field is placed on the axis and a numeric field (Sales) is placed in the values. Pay attention to the tip about using the date field directly, not the date hierarchy, to ensure a continuous axis suitable for forecasting.
Applying a Forecast: A Step-by-Step Guide
Once you have your time-series data displayed in a line chart, you can apply a forecast through the Analytics pane.
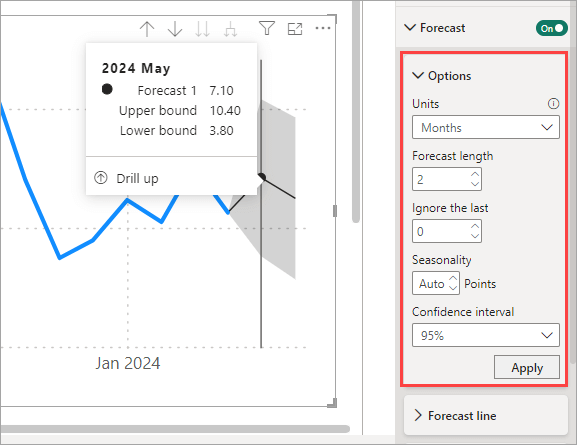
Here is the process you will guide your workshop participants through:
- Select the line chart to make the "Visualizations" pane active.
- Click on the magnifying glass icon to open the Analytics pane.
- Scroll down and expand the Forecast section.
- Click + Add to create a new forecast.
This will immediately add a basic forecast to your chart. The real power comes from configuring its parameters to match your data and business needs.
This article from Microsoft's official documentation confirms these steps and the limitations of the feature.
Use the Analytics pane in Power BI Desktop
This section of the Microsoft Power BI documentation, 'Use the Analytics pane in Power BI Desktop', officially describes how to access and apply the forecasting feature.
Read the sections 'Apply forecasting' and the subsequent 'Considerations and limitations'. This will confirm that the forecast feature is only for line charts and lists which other visuals support different analytical lines. This is useful knowledge for answering questions in your workshop.
Configuring the Key Forecast Parameters
For managers, the settings in the Forecast menu can seem intimidating. Your role is to demystify them. Let's focus on the three most important settings:
-
Forecast length: This determines how far into the future you want to predict. The "units" are based on the data points in your chart. If your data is monthly, a forecast length of "12" will predict 12 months ahead. If it's daily, a length of "30" will predict 30 days ahead.
-
Confidence interval: This is a crucial concept to explain. The forecast is not a single guaranteed number; it's a probable estimate. The confidence interval (the shaded area around the forecast line) shows the range where the actual values are likely to fall, with a certain level of confidence (e.g., 95%). A wider band means more uncertainty; a narrower band means more certainty.
-
Seasonality: This is often the most critical setting for getting a useful forecast. Seasonality refers to predictable, repeating cycles in your data. For example, retail sales often have a yearly seasonality with peaks in December.
- If your data is monthly and has a yearly cycle, the seasonality is 12 (points).
- If your data is daily with a weekly cycle (e.g., more sales on weekends), the seasonality is 7.
- If your data is daily with a yearly cycle, seasonality is 365.
Leaving this on "Auto" can work, but manually setting it based on business knowledge often produces a much more accurate forecast.
The following video provides an excellent, clear walkthrough of applying these settings and demonstrates the dramatic impact of setting seasonality correctly.
Time Series Forecasting in Power BI
Let's watch a more detailed demonstration from 'Time Series Forecasting in Power BI'. This video walks through each key setting and explains its purpose.
Watch from 00:53 to 03:20. Pay close attention to these parts: 00:53 - 01:18: Accessing the forecast option. 01:18 - 02:15: Setting the Forecast length and interpreting the Confidence interval. 02:15 - 03:20: The importance of Seasonality. Notice how the forecast changes from a flat, useless line to a meaningful prediction once seasonality is set to 12 for monthly data.
Test your understanding!
A logistics manager is analyzing daily shipment data from the past three years. They notice that every Friday, there is a significant spike in shipments as the company rushes to get orders out before the weekend. They want to forecast shipment volume for the next month (30 days).
What value should they enter for Seasonality to create an accurate forecast?
Show answer
They should enter 7 for Seasonality. Because the data is daily and the pattern (the spike) repeats every week, the length of the cycle is 7 days.
Interpreting the Results and Avoiding Common Mistakes
Creating the forecast is only half the battle. Teaching managers to interpret it wisely is just as important.
When the forecast is applied, the line chart will show the prediction and the confidence band.

To help your workshop audience become critical consumers of these forecasts, it's essential to highlight common pitfalls.
How to Use Power BI for Forecasting: A Step-by- ...
The article 'How to Use Power BI for Forecasting' provides an excellent summary of common mistakes that new users make. This is perfect material for your workshop.
Read the section titled 'Common Mistakes to Avoid'. Focus on the four key issues: Using too little data Ignoring outliers Skipping seasonality Treating forecasts as certainties
In your workshop, you can frame this as a checklist for managers:
- "Do I have enough historical data (ideally at least one full cycle)?"
- "Are there any one-off events in my history (like a factory shutdown or a massive clearance sale) that might be skewing the prediction?"
- "Have I correctly identified the business cycle (weekly, monthly, yearly) and set the seasonality?"
- "Am I treating this as a definite future or as a probable range of outcomes?"
Conclusion
In this lesson, you have learned the practical, step-by-step process for creating a forecast in Power BI. You are now equipped to guide managers through selecting a line chart, navigating the Analytics pane, and configuring the essential parameters of forecast length, confidence interval, and seasonality.
Key Takeaways for Your Workshop:
- Start with the Right Foundation: Emphasize the need for clean time-series data and a line chart.
- Focus on the Core Settings: Teach managers to confidently set the Forecast Length, understand the Confidence Interval, and, most importantly, define the Seasonality based on their business knowledge.
- Provide a Hands-On Walkthrough: Use a clear, step-by-step demonstration, similar to the videos we watched, to build practical skills.
- Teach Critical Interpretation: Remind your audience that a forecast is a tool for guidance, not a guarantee. Highlighting common mistakes will empower them to create and use forecasts more responsibly.
Preview of the Next Lesson:
We have now covered how to create a forecast. The next lesson, "Interpret forecast results, including confidence intervals and their limitations," will build directly on this foundation. We will take a deeper dive into what the forecast outputs are telling us, how to properly communicate the uncertainty represented by confidence intervals, and discuss the inherent limitations of Power BI's "black box" forecasting model.