Hello! Welcome to the first lesson in our module on "Forecasting and Predictive Insights."
In our previous lessons, we've used Power BI's AI features to understand our data better. We used the Decomposition Tree to explore root causes and the 'Analyze' feature to understand the story behind past performance. Now, we are shifting our focus from looking backward to looking forward.
This lesson addresses the learning outcome: Explain what forecasting is and identify appropriate use cases. For your workshop, this is a crucial conceptual foundation. Before you teach managers how to create a forecast in Power BI, you need to convince them why it's a powerful tool for planning and decision-making. We'll define the concept, place it within the broader field of analytics, and explore concrete examples of how it solves real-world business problems.
What is Forecasting?
At its core, forecasting is a technique that uses historical data as an input to make informed predictions about the future. It's about moving from guesswork to data-driven estimation.
To start, let's watch a short video that provides a clear, high-level definition.
What is Forecasting? | Process & Benefits of Forecasting
This clip from the video 'What is Forecasting?' by Educationleaves offers a concise definition and introduces the core idea.
Watch the segment from 00:22 to 01:10. Focus on the key purpose of forecasting: helping businesses plan and cope with uncertainty by examining historical data.
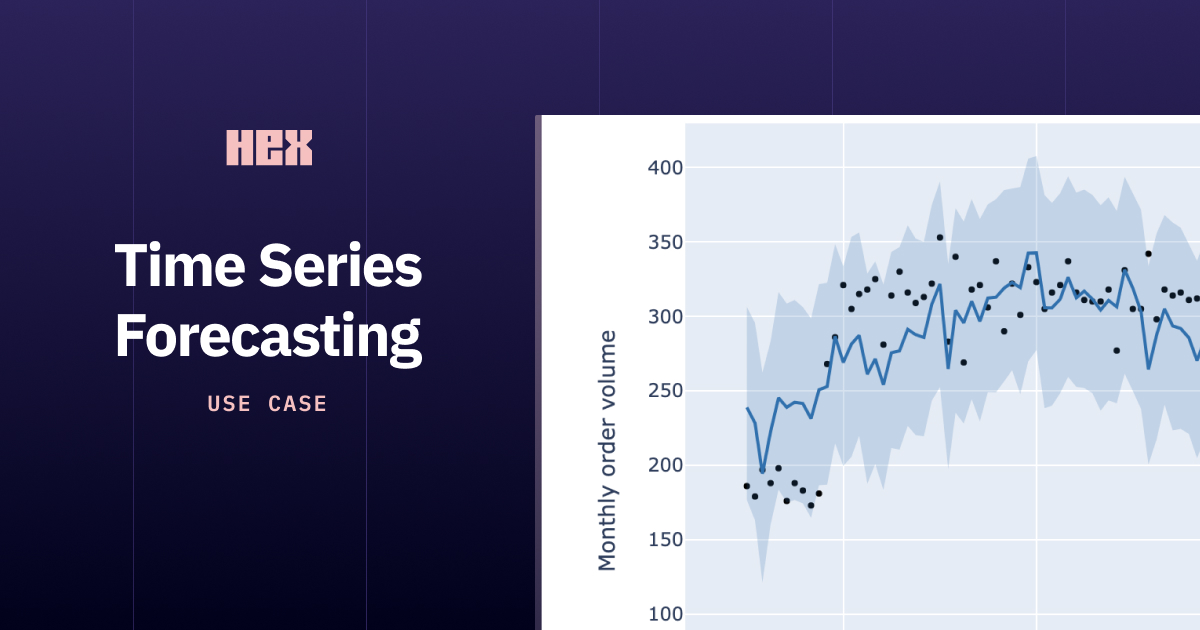
Forecasting is essentially about identifying patterns and trends in past data and projecting them into the future. For example, if sales have consistently grown by 5% every quarter for the last two years, a simple forecast might predict a similar 5% growth for the next quarter.
Forecasting in the Analytics Landscape
You'll often hear forecasting mentioned alongside a broader term: predictive analytics. To effectively teach this topic, it's important to understand the relationship between them. Predictive analytics is a category of data analytics that focuses on making predictions about future outcomes. Forecasting is a very common type of predictive analytics, specifically one that deals with time-series data (data points indexed in time order).
The article below from Harvard Business School Online provides an excellent framework by outlining four types of data analytics. This will help you position forecasting correctly for your audience.
4 Types of Data Analytics to Improve Decision-Making
Please read a section from the article '4 Types of Data Analytics to Improve Decision-Making'. It places predictive analytics in context with other types of analysis that managers will already be familiar with.
Read the section titled '4 Key Types of Data Analytics'. Pay close attention to the question each type answers: Descriptive: What happened? (e.g., sales charts) Diagnostic: Why did it happen? (e.g., Power BI's 'Analyze' feature) Predictive: What might happen in the future? (This is where forecasting fits) Prescriptive: What should we do next?
This framework is a powerful teaching tool for your workshop. You can explain that managers are already doing descriptive and diagnostic analytics every time they look at a sales report and ask why numbers went up or down. Forecasting is simply the next logical step: using that same data to anticipate what comes next.
Why Forecast? Identifying Business Use Cases
The real value of forecasting for a manager is its ability to answer critical business questions and support strategic planning. Let's move from the "what" to the "why" by exploring common use cases.
The video below gives several examples of how predictive analytics, including forecasting, is applied across different industries.
What is predictive analytics? Transforming data into future insights
This clip from 'What is predictive analytics?' by TECHtalk shows the breadth of applications in sectors like retail, hospitality, and finance.
Watch the section from 00:31 to 01:20. As you watch, think about which of these examples would resonate most with a general audience of industry managers.
As the video shows, the applications are extensive. For your workshop, it's helpful to frame these use cases as answers to specific managerial questions:
- Sales & Demand: "How many units of Product X will we sell next quarter?" "Will demand for our services increase during the summer?"
- Inventory & Operations: "How much inventory should we order to avoid stockouts during the holiday season?" "How many service technicians will we need on call next month?"
- Finance & Budgeting: "What will our revenue look like for the next fiscal year?" "Can we project our cash flow to see if we'll have a shortfall in six months?"
- Staffing & HR: "How many customer support agents do we need to hire to handle the projected call volume?"
This document provides a great summary of these benefits in business terms.
THE FUNDAMENTALS OF BUSINESS FORECASTING
The document 'THE FUNDAMENTALS OF BUSINESS FORECASTING' lists ten practical benefits that directly translate to business value.
Read the section '10 Benefits of Forecasting'. This list is perfect for framing the value proposition to a managerial audience. Note how the benefits range from controlling expenses and managing cash flow to optimizing staffing and improving customer satisfaction.
This slide provides a compelling visual summary of use cases and their impact across various industries. It's a great resource to adapt for your own workshop presentation.

Test your understanding!
A manager of a manufacturing plant is responsible for creating the annual budget. They need to estimate electricity costs for the upcoming year, which tend to be higher in the summer due to air conditioning and lower in the spring/fall.
Which type of analytics would be most directly applicable to this task, and what historical data would they need?
Show answer
Predictive analytics (specifically time-series forecasting) would be most applicable. The manager would need historical data of the plant's monthly electricity consumption and costs for the past several years to identify the seasonal pattern and forecast future costs.
Conclusion
In this lesson, you've built the conceptual groundwork for teaching forecasting. You can now explain what it is, where it fits within the broader analytics landscape, and most importantly, why it matters to a business manager.
Key Takeaways for Your Workshop:
- Define Forecasting Simply: It's the process of using past data to predict future trends. It's not a crystal ball, but a tool for making more informed plans.
- Use the 4-Part Framework: Position forecasting as the natural progression from descriptive ("what happened?") and diagnostic ("why?") analytics to predictive ("what will happen?").
- Focus on Business Questions: Frame use cases around the concrete problems managers face, such as budgeting, staffing, and inventory management.
- Show the Impact: Use examples and visuals to connect forecasting to tangible business benefits like cost savings, revenue growth, and customer satisfaction.
Preview of the Next Lesson:
Now that we've covered the "what" and "why" of forecasting, the next lesson will dive into the "how." You will learn to apply built-in forecasting to time-series data in Power BI, turning these concepts into a practical skill you can pass on to your workshop attendees.