Hello! Welcome to the next lesson in our module on AI-Powered Analytics in Power BI.
In our previous session, we did a deep dive into the Decomposition Tree, a powerful tool for exploratory root cause analysis. You learned how to interpret its results by building a narrative, much like using the "Five Whys" method, to uncover the factors contributing to a business metric.
Today, we shift from open-ended exploration to answering a very specific, and very common, question: "Why did this number suddenly go up or down?" Our learning outcome is to use the 'Analyze' feature to explain increases and decreases in data points. This feature is one of Power BI's most impressive AI capabilities, designed to provide instant answers during data reviews, saving managers from the dreaded phrase, "I'll get back to you."
The "Why Did That Happen?" Problem
Imagine a manager presenting a quarterly sales report. The line chart shows a strong Q3 followed by a sharp drop in Q4. A senior leader points to the drop and asks, "What happened here?" Finding the answer would typically involve hours of slicing and dicing the data by region, product, customer segment, and more.
The Analyze feature in Power BI automates this entire process. Let's watch an introduction that frames this exact scenario.
Explain the Decrease - using AI in Power BI
The video 'Explain the Decrease - using AI in Power BI' from Efficiency 365 by Dr Nitin sets up the business problem perfectly and introduces the AI solution.
Watch the first six minutes of the video (00:13 - 05:56). Pay close attention to: The common business scenario presented at the beginning. How the presenter right-clicks on a data point to trigger the analysis. The explanation of what Power BI's AI is doing in the background—analyzing all other data columns to find influential factors.
As the video shows, this feature is a "hidden gem" activated with a simple right-click. It is context-aware; if you click on a data point that is lower than the previous one, it offers to "Explain the decrease." If it's higher, it offers to "Explain the increase."
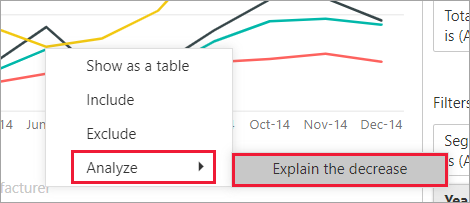
How Power BI Finds the Explanation
When you ask Power BI to explain a change, it runs a machine learning algorithm on your dataset. It doesn't just find the category with the biggest absolute drop. Instead, it looks for the factors whose relative contribution to the total changed the most significantly between the two periods.
For example, if the "Electronics" category always makes up 50% of your sales, and it made up 50% of the decrease, that's not very insightful. But if the "Apparel" category, which is usually 10% of sales, suddenly accounted for 40% of the decrease, the AI flags this as a significant contributing factor.
The official Microsoft documentation provides a good, concise explanation of this logic.
Apply insights in Power BI to explain fluctuations in visuals
This article, 'Apply insights in Power BI to explain fluctuations in visuals,' explains the logic behind the analysis and the different ways the results are visualized.
Please read the section titled 'Details of the results returned'. You don't need to memorize the specifics, but focus on understanding the core idea: the algorithm looks for columns where the breakdown of data changed the most between the two time periods.
Interpreting the AI-Generated Visuals
After the analysis, Power BI presents its findings in a new window. It defaults to a waterfall chart, but offers several other visual types to help you understand the story from different angles.
1. The Waterfall Chart (Default)
This chart is excellent for seeing the individual positive and negative contributions that make up the total change.
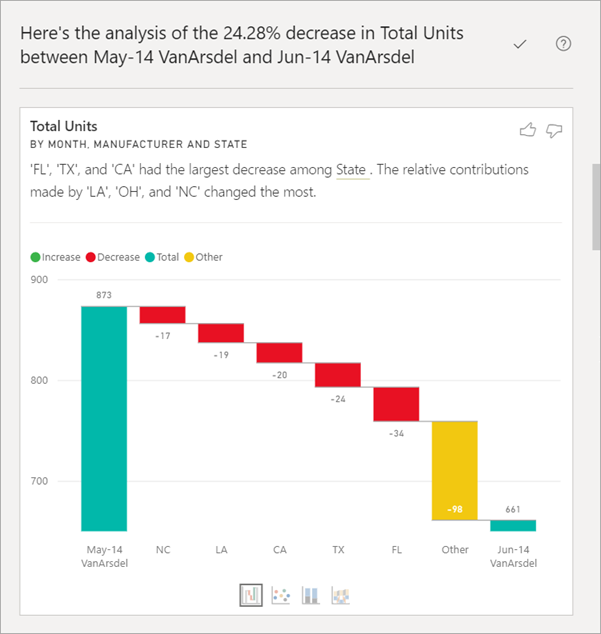
2. Other Chart Types
Sometimes, the waterfall chart isn't the best way to see the insight, especially if there are many contributing factors. Power BI provides three other options at the bottom of the window.
The following video segment gives a fantastic tour of these alternative charts and when each is most useful.
Explain the Decrease - using AI in Power BI
Let's return to the 'Explain the Decrease' video, which provides a great walkthrough of the different chart types and how to interpret them.
Watch the segment from 05:56 to 13:02. As you watch, make a mental note of the primary purpose of each chart type: Waterfall Chart: Shows the magnitude of each contributing factor. Scatter Chart: Best for visualizing many data points at once to spot outliers (items that went against the trend). Stacked Column Chart: Good for comparing the proportional mix before and after the change. Ribbon Chart: Uniquely shows if the ranking of contributors changed between the two periods.
To summarize for your workshop participants:
- Use the Waterfall to see the biggest drivers of the change.
- Use the Scatter Plot to find outliers when there are too many categories for the waterfall.
- Use the Ribbon Chart to see if top performers have fallen in rank.
Putting Insights into Action
Once the AI has generated an explanation you find useful, you can add it directly to your report page with a single click. This allows you to capture the insight and build it into your dashboard's narrative.
Let's see a final demonstration of the end-to-end process, including adding the generated visual to your report.
How to Use AI in Power BI to Make Smarter Dashboard?
The video 'How to Use AI in Power BI to Make Smarter Dashboard?' by Pavan Lalwani provides another clear, step-by-step demonstration of using this feature and saving the results.
Watch the segment from 21:53 to 31:34. Focus on how to: Initiate the 'Explain the increase' and 'Explain the decrease' on a column chart. Navigate through the different explanations (by region, segment, etc.). Click the plus + icon to add a chosen insight visual directly to the report canvas.
Test your understanding!
A manager is looking at a line chart of website traffic that shows a massive spike in visitors in April compared to March. They use "Analyze > Explain the increase". The AI generates a waterfall chart that shows 'Marketing Campaign: Spring Sale' is the biggest contributor.
What other chart type could they switch to if they wanted to see if the ranking of traffic sources (e.g., Google, Facebook, Direct) changed significantly in April?
Show answer
They should switch to the Ribbon Chart. The Ribbon Chart is specifically designed to visualize changes in rank over time, so it would clearly show if a traffic source like 'Facebook' jumped from the #3 spot to the #1 spot during the Spring Sale campaign.
Important Considerations for Your Workshop
When teaching this feature, there are a few key points to emphasize:
- It's a starting point: The AI provides data-driven hypotheses, not final conclusions. Managers must apply their business context to validate the insights.
- Best with time-series data: The feature works best on visuals that have a date or time sequence on the x-axis, like line charts and column charts showing trends.
- Limitations: The feature is not available for the very first data point in a visual (as there's no previous point to compare it to). The Microsoft Learn article, "Apply insights in Power BI to explain fluctuations in visuals," also lists a few other unsupported data sources and models in its "Considerations and limitations" section. It's good to be aware of these.
Conclusion
You are now equipped to teach managers how to use one of Power BI's most practical AI features. By replacing hours of manual analysis with a simple right-click, the Analyze feature empowers users to answer critical business questions on the spot.
Key Takeaways for Your Workshop:
- Frame the feature as the answer to the question, "Why did this number change?"
- Demonstrate the simple
Right-click > Analyze > Explain the increase/decreaseworkflow. - Explain the main visual outputs, especially the waterfall chart (for contribution) and ribbon chart (for rank change).
- Show how to add a valuable insight directly to the report page using the
+button. - Remind managers that AI provides the "what," but their expertise provides the "so what."
Preview of the Next Lesson:
We've used AI to explore data hierarchies with the Decomposition Tree and to explain past performance with the Analyze feature. In our next lesson, we will turn our attention to the future. You will learn how to apply built-in forecasting to time-series data in Power BI to predict future trends and understand their potential uncertainty.