Hello! Welcome to the final module of the course, "Performance Tracking and Store Management."
In our last lesson, we focused on how to generate the foundational sales reports from your Point-of-Sale (POS) system, like the daily X and Z reports. We established that these reports provide the raw data—the "what"—of your store's daily activity.
Now, we move from data collection to data interpretation. This is where the real value lies, and it's a process that should feel familiar from your digital marketing background. Just as you analyze website traffic or campaign data to understand customer behavior and optimize performance, you will now learn to do the same with your store's sales data.
This lesson directly addresses the learning outcome: Analyze sales reports to identify best-selling products, peak sales times, and trends. We'll explore how to transform the numbers from your daily reports into actionable business intelligence that will drive your store's success.
1. Beyond Total Revenue: The Power of Analysis
A Z report might tell you that you made $1,250 in a day. That's a crucial number, but it doesn't tell you the full story. To make smart decisions, you need to dig deeper and ask:
- Which products contributed most to that revenue?
- When during the day were sales the highest?
- How does this day compare to last week or last month?
Answering these questions allows you to optimize everything from inventory and staffing to marketing and store layout.
To start, let's get a high-level view of why this analysis is so critical for a retailer.
8 ways retailers can interpret sales data in Analytics for LS ...
The article '8 ways retailers can interpret sales data' from LS Retail provides an excellent overview of how to turn sales data into business insights. We'll focus on a few key sections for this lesson.
Please read the first section, '1. Get an overview of your sales performance'. Focus on why a single, comprehensive overview is more powerful than just looking at isolated numbers.
Just as a digital marketing dashboard consolidates metrics like click-through rate, conversion rate, and cost per acquisition, a retail sales dashboard brings together your key business metrics.
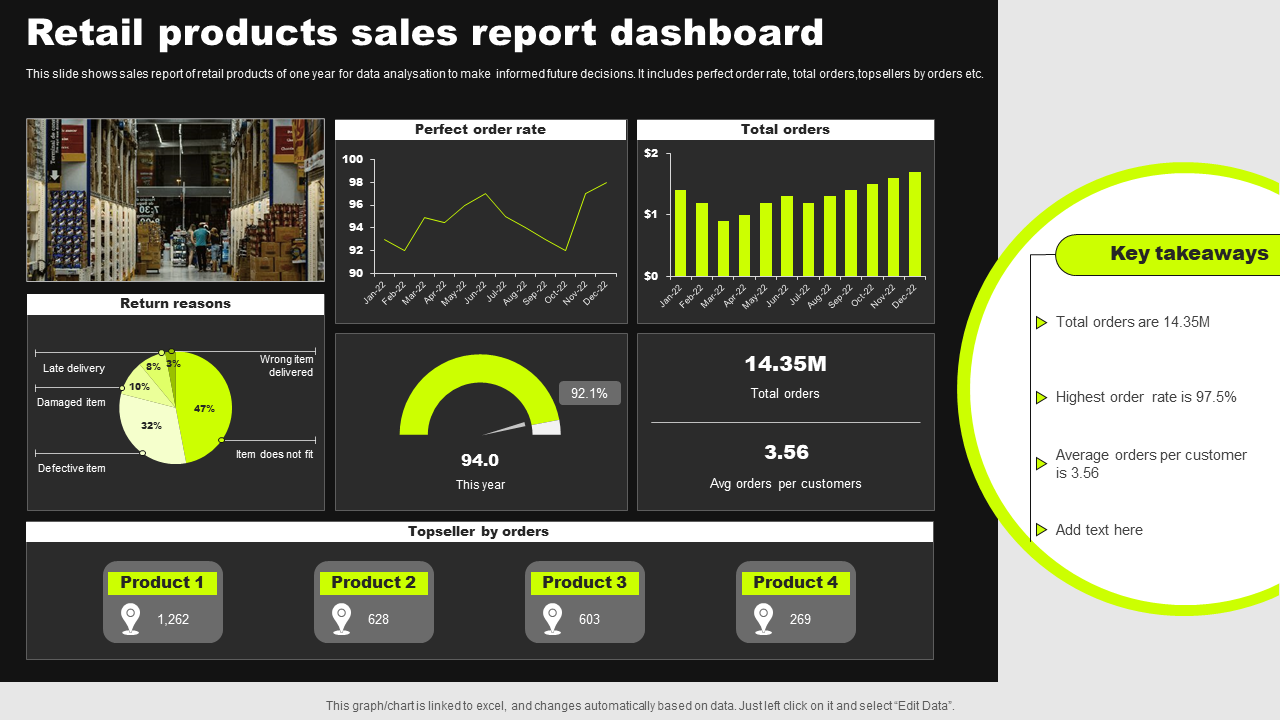
2. Identifying Your Best-Selling Products
Your best-selling products are the stars of your store. Knowing which products these are is fundamental to your success. This information directly impacts your purchasing, merchandising, and promotional strategies.
8 ways retailers can interpret sales data in Analytics for LS ...
Let's return to the LS Retail article to understand how to identify and leverage your top-performing items.
Read section 2, 'Understand your best-selling items'. Pay attention to the actions you can take once you've identified both high-performing and underperforming products.
What a "Top Products" report tells you:
A standard report from your POS system should allow you to rank products by either sales volume (number of units sold) or sales value (total revenue generated). Both views are important. A low-cost item like a lip balm might be a top seller by volume, while a high-end anti-aging serum might be a top seller by value.
How to act on this data:
Once you know your best and worst sellers, you can make informed decisions.
How to Use POS Reports & Analytics to Make Business Decisions
The article 'How to Use POS Reports & Analytics to Make Business Decisions' from Square provides practical advice on turning data into action. Let's look at what it says about inventory.
First, skim the section '4 POS reports you should be using' to see where inventory reports fit in. Then, read the subsection under 'How to use reports to make business decisions' titled 'Use inventory data to make purchase decisions'.
Based on this, here's a checklist of actions for your beauty mini-market:
- Best-Sellers:
- Inventory: Ensure these items are always in stock. Set higher reorder points for them.
- Merchandising: Place them in high-traffic, visible locations, like at eye-level on your shelves or near the checkout counter.
- Promotions: Use them as part of a bundle deal to help move slower-selling products.
- Worst-Sellers:
- Analyze: Why are they not selling? Is it the price, the placement, or a lack of customer interest?
- Action: Consider running a clearance sale, repositioning them in the store, or deciding not to reorder them to free up shelf space and capital for more profitable items.
3. Identifying Your Peak Sales Times
Understanding when your customers shop is just as important as knowing what they buy. This allows you to optimize staffing and plan targeted marketing activities.
8 ways retailers can interpret sales data in Analytics for LS ...
Let's revisit the LS Retail article to explore how to identify your most profitable periods.
Read section 3, 'See your most profitable periods'. Focus on how analyzing sales by day of the week and time of day can improve efficiency.
You can analyze sales data across different time frames:
- Time of Day: Are you busiest during the lunch hour (12-2 PM) or after typical work hours (5-7 PM)?
- Day of the Week: Are Saturdays your busiest day? Are Mondays consistently slow?
- Month/Season: Do you see a spike in sales for gift sets in November/December? Does sunscreen sales peak in the summer?

How to act on this data:
Knowing your peak times helps you run a leaner, more effective operation.
How to Use POS Reports & Analytics to Make Business Decisions
The Square article offers concrete examples of how to use this temporal data.
Please read the subsections 'Use sales data to make staffing decisions' and 'Use transaction data to determine seasonality'. These provide clear, actionable strategies based on sales timing.
Key actions include:
- Staffing: Schedule more staff during your busiest days and hours to ensure excellent customer service and prevent lost sales. On slower days, you can operate with a leaner team.
- Marketing: Run special promotions during your historically slow periods (e.g., a "Tuesday Treat" discount) to drive traffic.
- Operations: Plan tasks like restocking or cleaning for your slowest hours to minimize disruption to customers.
4. Spotting Trends and Putting It All Together
Analyzing trends means looking at your performance over longer periods (month-over-month, year-over-year) to understand the big picture. Are your sales growing, stagnating, or declining? Is there a seasonal pattern you can predict and plan for?
This is very similar to tracking the performance of a long-term SEO strategy or a year-long content marketing plan. The goal is to distinguish between short-term fluctuations and long-term trajectories.
Most modern POS dashboards will allow you to create charts to visualize this data. Let's watch a practical example of how raw sales data can be turned into an analytical dashboard.
Daily Sales Report Form in Google Sheets | Step by Step tutorial
This video from Neotech Navigators demonstrates how to build a sales dashboard in Google Sheets. While you'll likely use a POS system's built-in tools, this clearly shows the principle of turning a list of transactions into useful charts. We will focus on the part where the dashboard is being created.
Watch the section from 08:10 to 15:06. You don't need to follow the step-by-step instructions to build it yourself. Instead, focus on how the presenter creates different charts—like 'total sales by product' and 'total sales by month'—from a master database of sales. This illustrates how the concepts we've discussed are visualized.
The charts created in the video directly correspond to the analysis we've discussed:
- Sales by Product: Helps identify your best-sellers.
- Sales by Month: Helps identify seasonal trends and overall growth.
Conclusion
In this lesson, you've learned to move beyond simple data collection and into the realm of strategic analysis. By dissecting your sales reports, you can uncover the stories hidden within your data.
Key Takeaways:
- Analyze Best-Sellers: Use "Top Product" reports to identify your star products and your slow-movers. Use this insight to manage inventory, optimize store layout, and plan promotions.
- Identify Peak Times: Analyze sales by hour, day, and month to discover your busiest periods. Use this knowledge to create efficient staff schedules and targeted marketing campaigns.
- Spot Trends: Look at data over longer periods to understand your store's growth trajectory and seasonal patterns, allowing for better long-term planning.
- Action is Key: The ultimate goal of analysis is to make smarter, data-driven decisions that improve your store's profitability and customer experience.
Next Lesson Preview:
In our final lesson, we will broaden our scope to evaluate overall store performance and identify areas for improvement. You will learn how to combine the specific insights from your sales analysis with the KPIs we defined earlier (like conversion rate and sales per square foot) to conduct a holistic health check of your business and create a plan for continuous improvement.