Hello! Welcome to the final lesson of your course on building and managing an offline retail store. You've come a long way—from the initial concept to the detailed mechanics of daily operations. Congratulations on reaching this important milestone.
In our last lesson, we focused on analyzing specific sales reports to identify your best-selling products and peak business hours. We learned how to extract the "what" and "when" from your data.
Today, we take the final and most critical step: moving from analysis to evaluation. We will synthesize all the different data points and Key Performance Indicators (KPIs) you've learned about to assess your store's health holistically. In your digital marketing work, this is equivalent to preparing a comprehensive campaign-end report that evaluates overall success against objectives, rather than just looking at daily click rates.
This lesson addresses the final learning outcome of the course: Evaluate overall store performance and identify areas for improvement. By the end of this lesson, you will have a framework for continuously monitoring your business, making data-driven decisions, and creating a cycle of constant improvement.
1. The Performance Management Cycle
Successful retail management isn't about looking at data once in a while; it's about building a continuous cycle of monitoring, analysis, and action. Your experience with optimizing digital campaigns has already prepared you for this mindset.
To formalize this, let's explore the distinction between simply collecting data and actively using it to manage performance.
Retail Monitoring, Performance Management, and Key KPIs
The article 'Retail Monitoring, Performance Management, and Key KPIs' by GoAudits provides an excellent framework for this process. It breaks down how data collection (monitoring) serves as the foundation for strategic decision-making (performance management).
Please read the first two major sections: 'Retail Monitoring: What It Is and Why It Is Important for Performance Management' and 'What are Retail Performance Management and KPIs?'. Focus on understanding the five-step process for effective monitoring and how it fuels performance management.
As the article highlights, the process is a closed-loop system:
- Define Objectives & KPIs: Decide what success looks like.
- Collect Data: Gather information from your POS, foot traffic counters, and even qualitative checklists.
- Centralize & Analyze: Bring the data together to spot trends and compare against targets.
- Create an Action Plan: Decide what to do based on the data.
- Follow-Up: Implement the plan and track its impact, which starts the cycle over again.
This is the strategic engine that will drive your store forward.
2. Building Your Store's Performance Dashboard
To evaluate your store's health, you need a holistic view that goes beyond just daily revenue. Just as a marketing dashboard shows metrics like traffic, leads, and conversion rates, your retail dashboard should display a balanced set of KPIs.
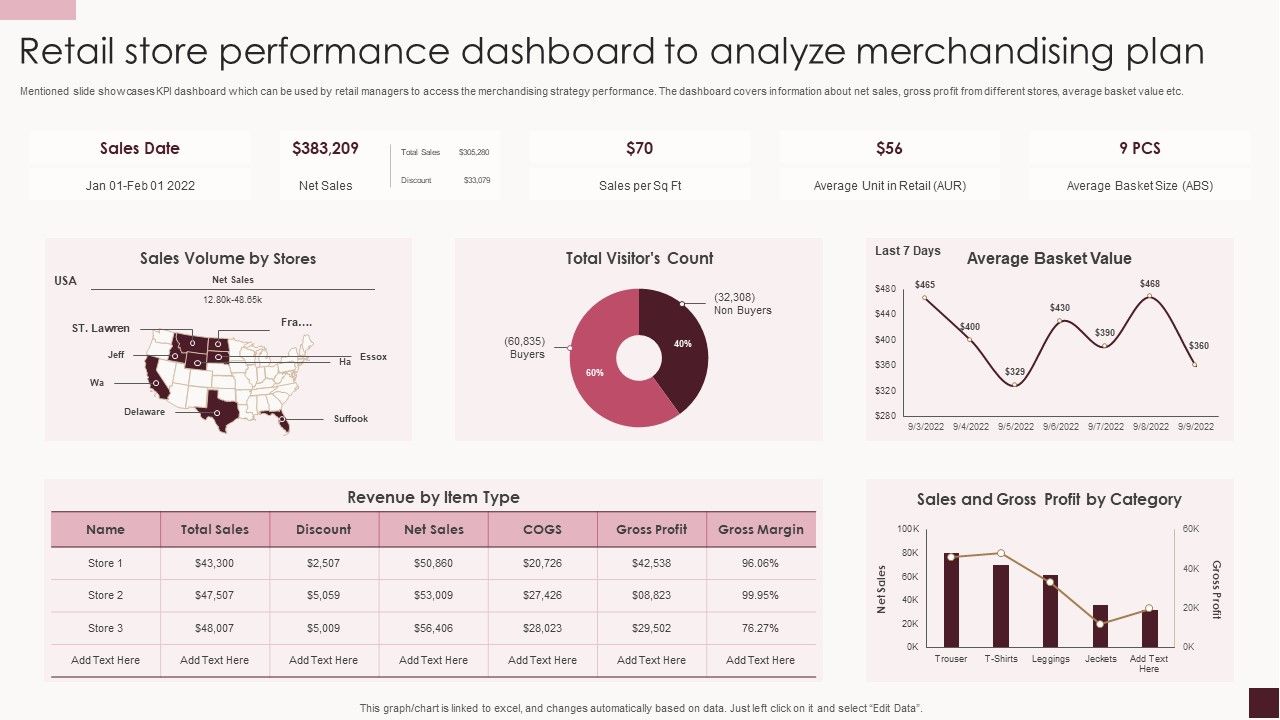
To build this view, you'll bring together the key KPIs we discussed in Module 1 and throughout the course. Let's refresh our memory on the most important ones.
Retail Monitoring, Performance Management, and Key KPIs
The GoAudits article we just looked at also contains a great summary of essential retail KPIs. Let's review the categories to understand what a balanced dashboard includes.
Read the section 'Top KPIs in Retail: What to Track for Performance Management'. Pay close attention to the definitions under each category: Sales, Customer, Inventory, Profitability, and Operational metrics. These are the building blocks of your dashboard.
For your beauty mini-market, let's zoom in on a few of the most critical KPIs. The following resource is specifically about beauty supply stores, making its concepts highly relevant.
A quick note on the next resource: The article provides an excellent framework, but some of its target numbers (like an 860% Gross Margin) are mathematically impossible for standard retail or based on a very specific, unconventional business model. Focus on the definition and purpose of each KPI, not the specific target values presented.
7 Critical KPIs for Beauty Supply Store Success
Let's explore '7 Critical KPIs for Beauty Supply Store Success' from Financial Models Lab. We will focus on a few KPIs that are especially important for a new store.
Please read the sections for KPI 1 ('Visitor-to-Buyer Conversion Rate'), KPI 2 ('Average Order Value (AOV)'), and KPI 5 ('Inventory Turnover Ratio (ITR)'). For each one, concentrate on the 'Definition', 'Advantages', and 'How to Improve' sections.
Let’s summarize the key evaluation questions these KPIs help you answer:
- Conversion Rate: How effective is my store environment and sales staff at turning a visitor into a paying customer?
- Average Order Value (AOV): Are my staff successfully encouraging customers to buy more through recommendations and cross-selling?
- Sales per Square Foot: Am I using my expensive retail space efficiently?
- Inventory Turnover: Is my capital getting stuck in slow-moving stock, or is my inventory selling through at a healthy pace? This is crucial for products with expiration dates.
3. From Evaluation to Action: A Practical Guide
Knowing your numbers is only half the battle. The crucial next step is turning that knowledge into a concrete action plan. This is where you connect a lagging KPI to a potential root cause and devise a solution.
Retail Monitoring, Performance Management, and Key KPIs
Let's return to the GoAudits article for a final time to look at actionable strategies for improvement.
Read the final section, 'Best Practices in Retail Performance Management'. Focus on how the article connects KPI data to specific actions like employee training and updating procedures.
To make this practical for your beauty mini-market, here is a troubleshooting framework. Think of this as your go-to guide when you see a performance indicator dip.
If... Then... A Guide to Improving Your Store
-
If
Conversion Rateis low...- Then Analyze: Are staff greeting every customer? Is the music too loud or the lighting too dim? Are your best-sellers hidden in the back?
- Then Act:
- Role-play customer service scenarios with your staff.
- Conduct a "sensory audit" of the store's atmosphere.
- Move your top-performing products to a more prominent display near the entrance.
-
If
Average Order Value (AOV)is low...- Then Analyze: Does your staff know which products complement each other? Are there any incentives for customers to add one more item to their basket?
- Then Act:
- Create a "Pairs Well With" cheat sheet for staff (e.g., this foundation pairs with this primer).
- Place lower-cost, high-impulse items like lip balms and face masks at the checkout counter.
- Introduce a "buy 3, get 1 free" on select items like sheet masks.
-
If
Sales per Square Footis low in one zone...- Then Analyze: Use your POS reports from the last lesson. Are the products in that zone unpopular? Is the area poorly lit or difficult to access?
- Then Act:
- Replace the underperforming products with a proven best-seller.
- Install brighter, focused lighting on the shelves in that zone.
- Slightly rearrange fixtures to create a clearer path for customers.
-
If
Inventory Turnoverfor a brand is low...- Then Analyze: Are the products nearing their expiration dates? Is the price point too high compared to competitors? Is the packaging not drawing attention?
- Then Act:
- Implement a clear First-In, First-Out (FIFO) process for restocking to sell older stock first.
- Create a special promotion or bundle to move the items before they expire.
- Consider discontinuing the brand if performance doesn't improve after intervention.
Conclusion and Course Wrap-Up
In this final lesson, we've brought everything together to build a system for evaluating and improving your store's performance. You now have the tools to be a proactive, data-driven retail owner.
Key Takeaways:
- Embrace the Cycle: Store management is a continuous loop of monitoring performance, analyzing the data, and taking decisive action.
- Use a Balanced Dashboard: Evaluate your store's health by looking at a combination of sales, customer, operational, and inventory KPIs.
- Connect Data to Action: Don't just admire the data. Use it to diagnose problems and identify concrete opportunities for improvement.
- Turn Insights into Improvement: A low KPI is not a failure; it's an opportunity to learn, adapt, and make your business stronger.
You have now completed the course on building and managing your offline retail store. From defining your business model and researching your market to designing your store, sourcing products, and now, tracking performance—you have built a complete roadmap for your entrepreneurial journey.
Your background in the data-rich world of digital marketing gives you a unique advantage. Apply that same analytical rigor and customer-centric focus to your physical store, and you will be well-equipped to navigate the challenges and seize the opportunities that lie ahead.
Congratulations again on your dedication. This is the end of the course, but it is the exciting beginning of your new venture. Best of luck