Hello! Welcome back to the "Performance Tracking and Store Management" module.
In our last lesson, we identified the essential Key Performance Indicators (KPIs) for your beauty mini-market, such as Conversion Rate, Average Transaction Value (ATV), and Sales per Square Foot. We established that these metrics are the "health report" for your store.
To calculate these KPIs, you need reliable data. In digital marketing, you pull this data from platforms like Google Analytics or social media dashboards. In physical retail, your primary source of data is your Point-of-Sale (POS) system. This lesson directly addresses the learning outcome: Generate standard sales reports from a typical retail point-of-sale system.
We'll explore the fundamental reports that every retail manager uses to track daily performance and provide the raw numbers for KPI calculation.
1. The Foundation of Daily Reporting: X and Z Reports
At the heart of daily retail operations are two types of reports that have been used since the days of traditional cash registers: the X Report and the Z Report. While modern, cloud-based POS systems may use different names, the underlying concepts are universal. Understanding them is crucial for daily financial control and long-term analysis.
Let's dive into what these reports are and how they differ.
What is an X report vs Z report?
To get a clear definition, please read the introductory sections of the article 'What is an X or Z report?' from MobileTransaction.org. This will explain the fundamental purpose of each report.
Read the section titled 'Definitions'. Focus on the distinction between an X report being a 'snapshot' and a Z report being the 'end-of-day' summary that resets the system.
To reinforce these concepts, here is another quick and clear explanation.
What's the difference between an X Report and a Z Report?
This article from Onslip's knowledge base provides a very practical breakdown of the two reports, emphasizing their different uses, especially regarding accounting.
Read the two main sections, 'X-report - a current report' and 'Z-report - daily closing and accounting documents'. Pay close attention to the bullet points that summarize their application and whether they can be used for accounting.
To summarize the key differences:
| Feature | X Report | Z Report |
|---|---|---|
| Purpose | Interim check, snapshot of sales | Final end-of-day summary |
| When to Run | Anytime during the day, multiple times | Once at the close of the business day |
| Effect on System | Does not reset sales data | Resets daily sales data to zero |
| Use Case | Checking mid-shift sales, balancing the cash drawer during a shift change. | Finalizing the day's total revenue, official document for accounting. |
Think of it this way: the X report lets you peek at the results during the race, while the Z report is the official final time logged after you cross the finish line.
2. What's Inside a Sales Report?
Now that we know when to run these reports, let's look at what information they contain. This is the raw data you'll use to calculate your KPIs.
The image below shows a side-by-side example of an X and a Z report.

Most standard sales reports will include:
- Opening Balance: The amount of cash in the drawer at the start of the day (the cash float).
- Sales/Returns: Total value of goods sold and refunded.
- Tax: Total sales tax collected.
- Discount: Total value of discounts given.
- Gross/Net Totals: The total revenue figures.
- Payment Breakdown: A summary of how much was paid by cash, credit card, etc.
- Number of Transactions: The total count of individual sales.
Connecting Reports to Your KPIs
Look closely at the reports above. You can see the direct link to the KPIs from our last lesson:
- To calculate Average Transaction Value (ATV), you would take the
Net Salesand divide it by the number of transactions (which is often listed, though not in this specific example). - The number of transactions is the numerator for your Conversion Rate calculation.
- The
Net Salesfigure is the numerator for your Sales Per Square Foot calculation.
3. Sales Reports in Modern POS Systems
Your digital marketing experience has taught you the value of real-time analytics dashboards. The good news is that modern cloud-based POS systems (like Square, Shopify POS, or Lightspeed) have moved in this direction.
As the MobileTransaction.org article noted, you may not see the buttons labeled "X Report" or "Z Report." Instead, you might find:
- Real-Time Dashboards: A live view of your sales, transactions, and top-selling products that you can check anytime, which serves the function of an X report.
- End-of-Day or Shift Reports: A function you run to close a shift or a business day. This serves the function of a Z report, finalizing the numbers for that period.
The image below shows an example from a modern POS interface.
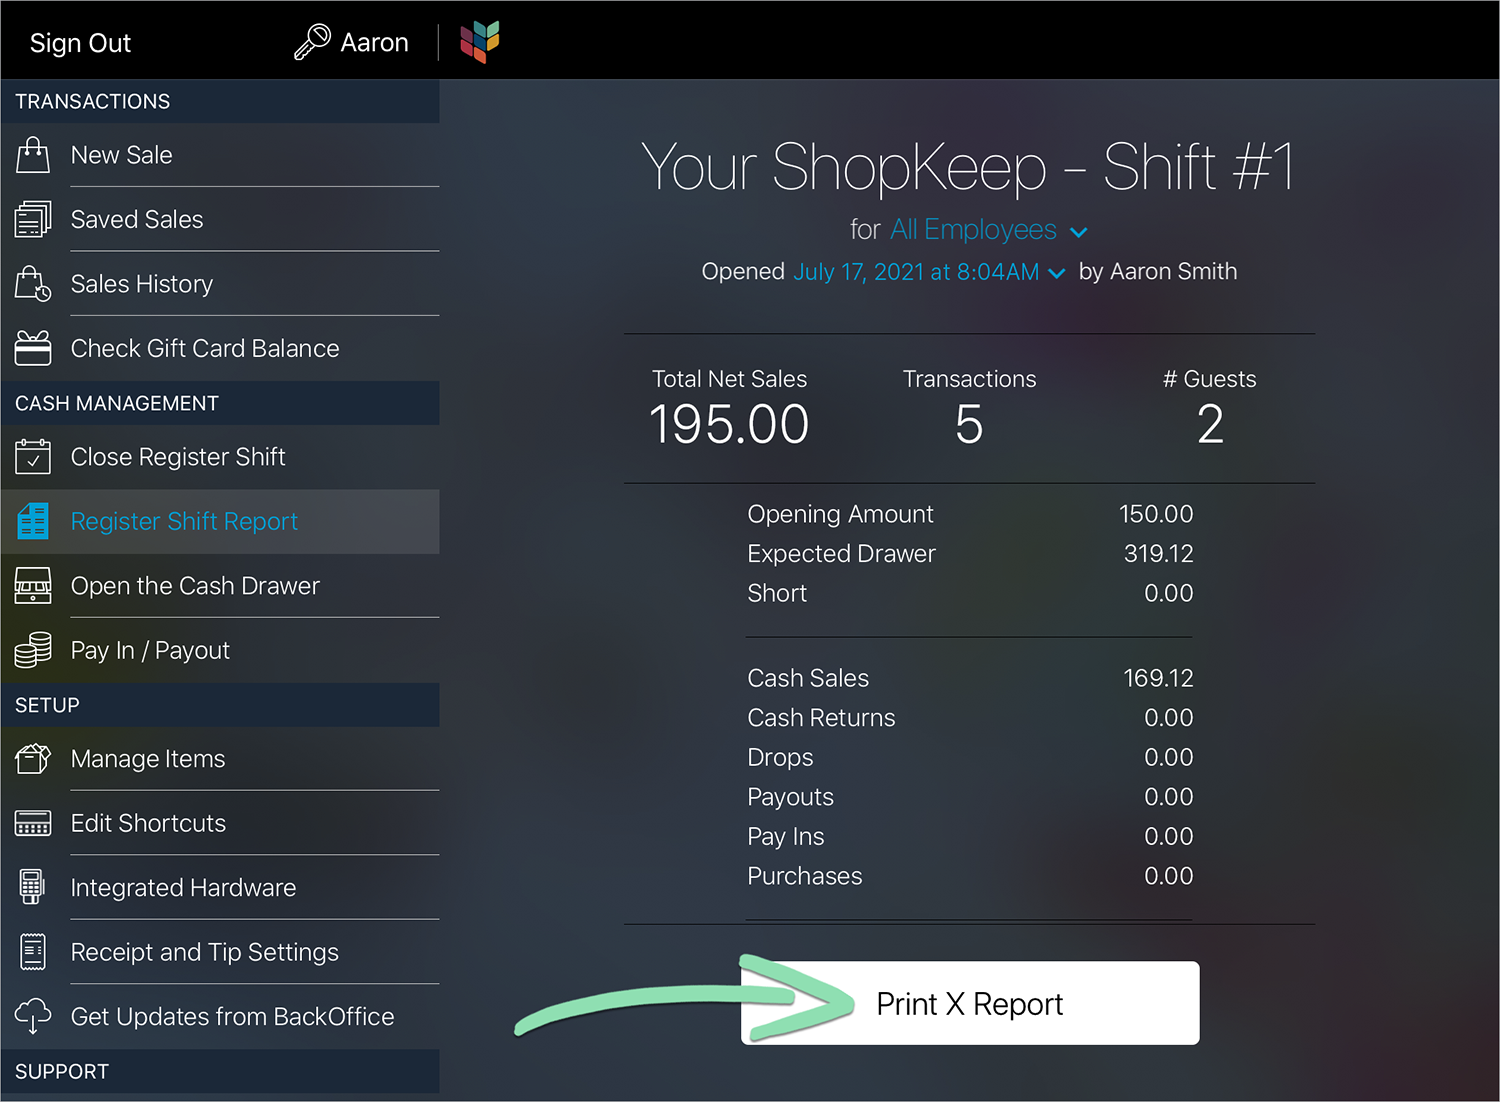
The core principle remains the same: you need a way to check progress during the day and an official process to "close the books" at the end of the day. Modern systems simply make this process more automated and user-friendly, often sending you an email with your "Z report" automatically after you close.
4. Application Exercise
Let's test your understanding with a few practical scenarios you'll face as a store owner.
Scenario: You are running your beauty mini-market on a busy Saturday.
-
Mid-day Check-in: It’s 2:00 PM and you're about to take your lunch break. Your part-time sales associate is taking over the register. You want to count the cash in the drawer to ensure it matches the sales made so far.
- Question: Which report would you run before counting the cash, and why?
-
Closing Time: It’s 7:00 PM, and you've just served your last customer. You need to prepare your bank deposit, finalize the sales figures for your accountant, and get the register ready for Sunday morning.
- Question: Which report is essential for this process? What is the most critical consequence of running this report?
-
Data for KPIs: The Z report you just printed shows the following:
- Total Net Sales: $1,250
- Number of Transactions: 50
- Question: Using only this data, which KPI from our previous lesson can you calculate? What is the result?
Take a moment to think through your answers. This will help solidify the practical difference between these two vital reports.
Conclusion
You've now learned how to generate the foundational reports that serve as the bedrock of retail performance tracking. While the technology has evolved from manual cash registers to cloud-based systems, the core principles of daily reporting remain constant.
Key Takeaways:
- X Reports are interim "snapshots" used for in-day checks, like cash balancing, and do not reset sales data.
- Z Reports are final "end-of-day" summaries that reset daily totals and serve as the official record for accounting.
- These reports provide the raw data—like total sales and number of transactions—needed to calculate the KPIs you learned about in the previous lesson.
- Modern POS systems may use different names (e.g., "Shift Report," "Daily Summary"), but they perform the same essential functions.
Next Lesson Preview:
Generating reports is the first step. The next, more powerful step is interpreting them. In our next lesson, we will move on to analyzing sales reports to identify best-selling products, peak sales times, and trends. You will learn how to look beyond the grand totals and uncover actionable insights that can help you optimize your product offering, staffing, and marketing efforts.