Hello! Welcome to your first lesson in the "Performance Tracking and Store Management" module.
In our last lesson, we designed a clienteling process to deliver personalized product recommendations. That strategy is about improving the quality of the customer experience. But how do you measure the impact of that strategy on your business? How do you know if it's working?
This is where Key Performance Indicators, or KPIs, come in. This lesson addresses the learning outcome: Identify key performance indicators for a beauty mini market such as sales per square foot, conversion rate, and average transaction value.
Coming from a digital marketing background, you're already familiar with tracking metrics like click-through rates, cost per acquisition, and online conversion rates to measure the health of your campaigns. Physical retail has its own set of critical metrics. This lesson will equip you with the essential KPIs to monitor your store's performance, make data-driven decisions, and translate your digital analytics skills to the physical world.
1. What are Key Performance Indicators (KPIs)?
KPIs are quantifiable measures used to evaluate the success of a business in meeting its objectives. Think of them as your store's health report. They tell you what's working well, what isn't, and where you need to focus your attention.
To get a quick overview of the most common retail KPIs, let's start with a short video.
Key Performance Indicators (KPI) Calculations in Retail | KPIs of Store Manager
This video from Retail & Marketing Concepts introduces the concept of KPIs in a retail context and lists nine fundamental metrics that store managers use. This will give us a solid frame of reference for our discussion.
Watch from the beginning until 01:00. Focus on the definition of a KPI and the list of indicators presented. You'll see several terms that we will explore in detail.
Now, let's dive into the most critical KPIs for your beauty mini-market, grouping them into two categories: Customer Behavior and Store Efficiency.
2. Measuring Customer Behavior
These KPIs help you understand how customers interact with your store and what drives their purchasing decisions. They are the direct equivalent of the user behavior metrics you track in e-commerce.
Foot Traffic & Conversion Rate
- Foot Traffic (or Walk-ins) is the number of people who enter your store. This is the offline equivalent of your website's "unique visitors."
- Conversion Rate (CVR) is the percentage of those visitors who make a purchase. It's one of the most vital signs of your store's health, telling you how effective your team, product selection, and store environment are at turning browsers into buyers.
Formula:
The video below explains this concept and gives some benchmark figures.
Key Performance Indicators (KPI) Calculations in Retail | KPIs of Store Manager
Let's watch the section of the previous video that focuses specifically on conversion rate. It provides a clear definition and calculation.
Watch from 04:12 to 05:07. Pay attention to the formula and the discussion on what makes a 'healthy' conversion rate.
As noted in the article "12 Critical Retail Industry Performance Metrics," in-store conversion rates typically range from 18% to 60%, which is much higher than typical e-commerce rates. Why? Because a customer who has made the effort to physically visit your store has a much higher purchase intent. Your personalized recommendation process is a powerful tool to boost this number.
Average Transaction Value (ATV)
- Average Transaction Value (ATV), also called Average Order Value (AOV) or Average Bill Value (ABV), measures the average amount of money a customer spends in a single transaction.
This KPI tells you whether customers are making small, single-item purchases or larger, multi-item hauls. Increasing your ATV is a powerful way to grow revenue without needing more foot traffic.
Formula:
Units Per Transaction (UPT)
- Units Per Transaction (UPT), also known as Average Basket Size, measures the average number of items sold in a single transaction.
This KPI is a perfect partner to ATV. A high ATV could mean you're selling one expensive item or many less-expensive items. UPT clarifies this. For a beauty store, a healthy UPT indicates successful cross-selling (e.g., selling a cleanser, serum, and moisturizer together instead of just one).
Formula:
Let's watch a video that concisely explains ATV and UPT and how to improve them.
Sales KPIs: ATV, UPT & Conversion | Retail Dogma
This short video from Retail Dogma does an excellent job of defining ATV and UPT and connecting them to practical sales techniques.
Watch from 00:01 to 01:29. Notice how techniques like upselling and cross-selling—which you designed in the last lesson—directly impact these two KPIs.
This is where the clienteling process you designed becomes a measurable asset. By recommending a full routine (cleanser, serum, moisturizer, SPF), you directly increase both UPT and ATV.
3. Measuring Store Efficiency
This KPI category measures how effectively you are using your physical space—your most significant asset and cost—to generate revenue.
Sales Per Square Foot
- Sales Per Square Foot is the ultimate measure of your store's productivity. It calculates the average revenue generated for every square foot of sales space. It helps you evaluate if your store's rent is justified and is critical for planning layouts and comparing your performance to industry benchmarks.
Important: When calculating this, you only use the area accessible to customers (the sales floor). You should exclude stockrooms, offices, and bathrooms.
Formula:
To see this calculation in action, let's return to our first video.
Key Performance Indicators (KPI) Calculations in Retail | KPIs of Store Manager
This final clip explains how to calculate Sales per Square Foot and why it's a key indicator of profitability.
Watch from 09:20 to 10:09. Focus on how this metric connects sales generation to the physical asset of your store.
4. Bringing It All Together: The Retail Dashboard
Individually, these KPIs are useful. Together, they paint a complete picture of your store's performance. Most modern Point-of-Sale (POS) systems will present this data in a dashboard format.

The KPIs we've discussed are just the starting point. As you grow, you'll track metrics related to inventory, customers, and employees.
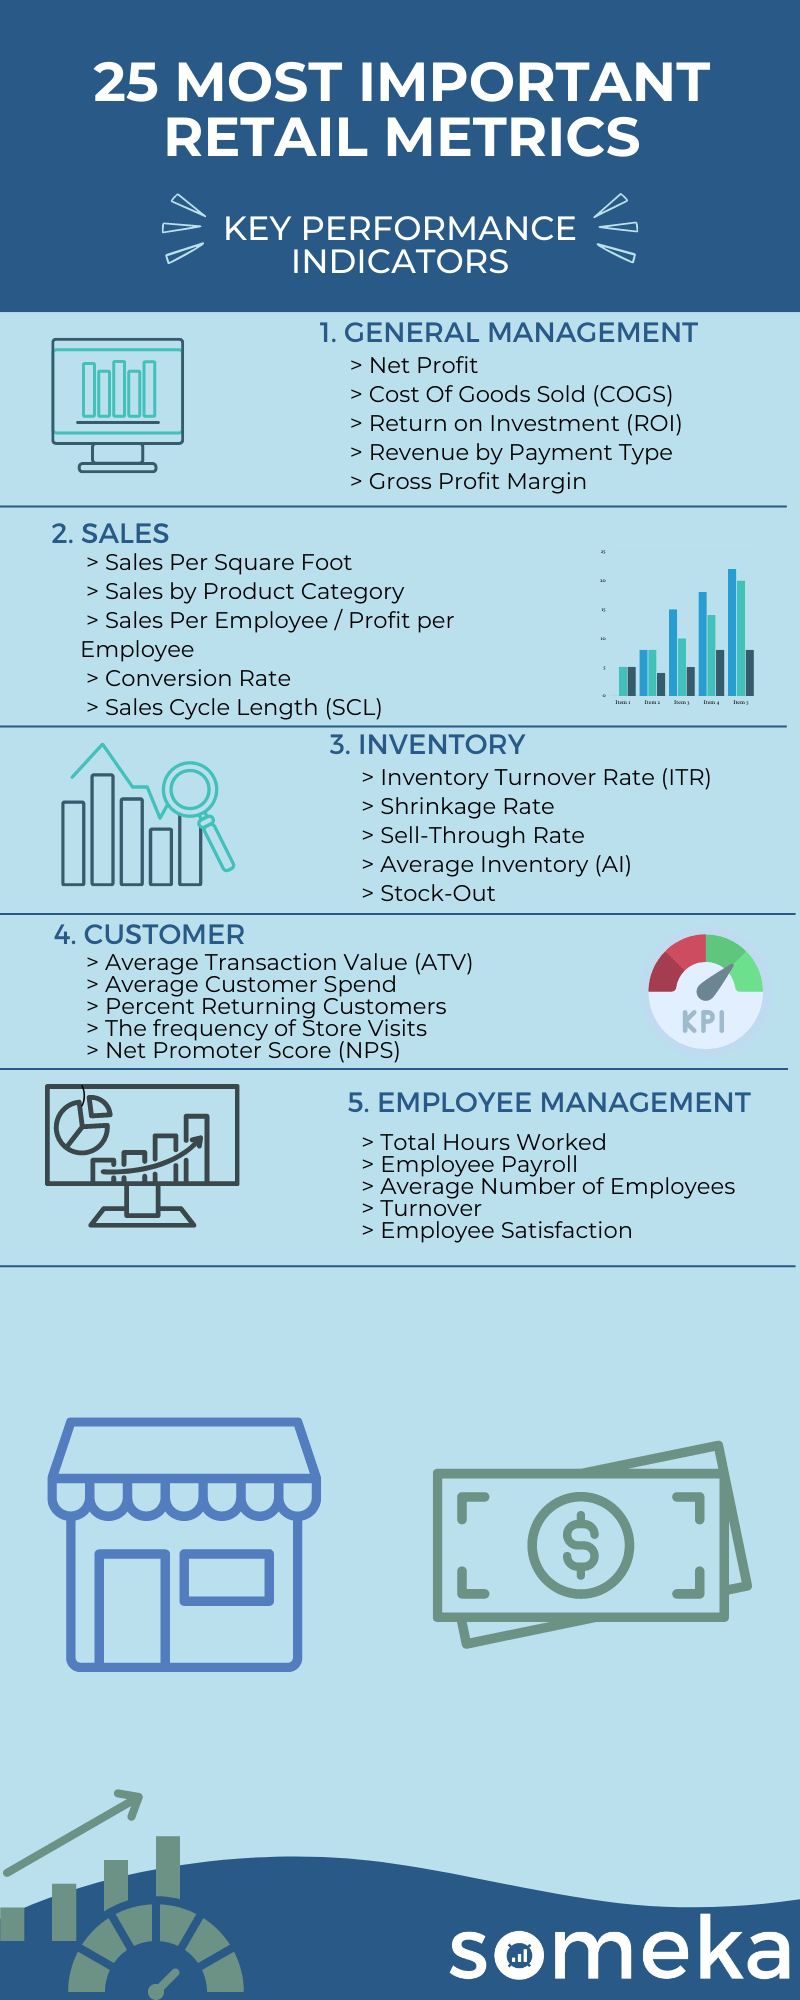
5. A Glimpse at Other Critical KPIs
While our focus today is on customer and store efficiency KPIs, it's worth briefly introducing two other types that are crucial for a beauty business. We will cover these in detail in future modules.
- Gross Margin Percentage (GM%): This measures your core profitability by showing what percentage of revenue is left after accounting for the cost of the products you sold (Cost of Goods Sold - COGS). This is fundamental to your pricing strategy.
- Inventory Turnover: This measures how many times you sell through your entire inventory in a given period. For a beauty store with products that have expiration dates, this is a vital metric to manage cash flow and prevent waste.
You can get a more detailed definition of these in the resource below, which is tailored specifically to cosmetics stores.
7 Essential Cosmetics Store KPIs
This article from Financial Models Lab, '7 Essential Cosmetics Store KPIs,' provides definitions for Gross Margin and Inventory Turnover. While some of its benchmark numbers appear to be typos (e.g., an AOV of $7,975 is likely meant to be $79.75), the underlying definitions are sound.
Quickly read the 'Definition' sections for 'KPI 3: Gross Margin Percentage (GM%)' and 'KPI 4: Inventory Turnover Ratio (ITR)'. This is just to familiarize yourself with the concepts; we will revisit them in Modules 7 and 8.
Application Exercise
Let's put this into practice. Imagine your beauty mini-market has just completed its first week. Here is your data:
- Total Sales Revenue: $5,250
- Foot Traffic: 350 people
- Number of Transactions: 75
- Total Items Sold: 225
- Sales Floor Area: 500 sq ft
Task: Calculate the following four KPIs for the week. Show your formulas.
- Conversion Rate
- Average Transaction Value (ATV)
- Units Per Transaction (UPT)
- Sales per Square Foot
Take your time to work through the calculations. This exercise will solidify your understanding of how to derive these crucial insights from raw data.
Conclusion
You now have a foundational understanding of the key performance indicators that will function as the control panel for your retail business.
Key Takeaways:
- Customer Behavior KPIs like Conversion Rate, Average Transaction Value (ATV), and Units Per Transaction (UPT) measure the effectiveness of your sales process and customer interactions.
- Store Efficiency KPIs like Sales Per Square Foot measure how productively you are using your physical space to generate revenue.
- These metrics are interconnected and provide a holistic view of your store's health, much like analytics do in digital marketing.
- Strategies like personalized selling directly and measurably impact these KPIs.
Next Lesson Preview:
Knowing these KPIs is the first step. The next is knowing how to get the data. In our next lesson, we will explore how to generate standard sales reports from a typical retail point-of-sale (POS) system. This is where you'll find all the raw numbers needed to calculate and track your KPIs over time.