Introduction
Welcome back! In our previous lesson, we established the foundational criteria for evaluating potential store locations. We created a qualitative checklist covering the three pillars of site selection: demographics, foot traffic and accessibility, and the competitive landscape. This gave you a framework for an initial "first-pass" evaluation of different sites.
Today, we will build directly on that foundation to tackle our next learning outcome: Assess a potential location using foot traffic analysis and demographic data.
We will move from the qualitative scorecard to a quantitative, data-driven assessment. Your background in digital marketing, where you analyze user data, click-through rates, and customer segments, has prepared you well for this. The principles are remarkably similar; we're just shifting the analysis from online clicks to offline footsteps and from digital personas to neighborhood profiles. This lesson will equip you with the methods to collect and interpret the data needed to make a strategic, evidence-based location decision.
1. A Framework for Site Analysis
Before we dive into the data, let's establish a clear, structured framework. A popular analogy in real estate is to think of site selection as a table with four legs. If any leg is weak or missing, the table becomes unstable.
This video from Franchise Frankness introduces this 'four-legged table' concept. It's a simple but powerful way to remember the essential, interconnected components of a strong location.
Watch the first part of the video, from 00:42 to 01:47, where the host explains the four core elements: physical site characteristics, demographics, trade area, and competition.
The four legs are:
- Physical Site Characteristics: Visibility, parking, accessibility, signage.
- Demographics: The statistical profile of people in the area.
- Trade Area: The surrounding businesses and amenities that draw customers.
- Competition: Direct and indirect competitors.
In our last lesson, we touched on all four. Today, we're focusing on the data-intensive components: using demographic data to understand the people and foot traffic analysis to quantify the activity around the physical site.
2. Decoding Demographics and Psychographics
In digital marketing, you target users based on their data profiles. In retail, you choose a location where your target customers are already concentrated. Demographic data tells you who is in a given area.
Finding the PERFECT location for your business | Business 101
Let's watch a segment from the video 'Finding the PERFECT location for your business' by Grant Navarre. He gives a very practical breakdown of the key demographic numbers a real estate agent might provide and explains what they mean for a business.
Watch from 01:20 to 02:49 and then from 03:26 to 04:59. Pay close attention to his emphasis on analyzing specific local areas rather than city-wide data, and the key metrics he discusses, such as population radius, income, and daytime population.
As the video highlights, the most critical demographic data points for your beauty mini-market are:
- Population within a Radius: Look at the population in 1, 3, and 5-mile radii. Is the area dense enough to support your store? Is the population projected to grow?
- Average Household Income: This is a proxy for disposable income. For a beauty mini-market that isn't strictly a discount store, you need to be in an area where customers can afford non-essential, "feel-good" purchases.
- Daytime Population: This measures the number of people who work in the area, not just live there. A high daytime population from nearby offices can drive significant lunch-hour and post-work traffic.
- Age and Gender: Your real estate data should also break down the population by age and gender, allowing you to see if the area aligns with your target customer (e.g., women aged 20-50).
Going a Step Further: Psychographics
While demographics tell you who people are, psychographics tell you how they live and what they value.
This article from Pass_By, which we'll refer to again, introduces the concept of psychographics alongside demographics. It's a brief but important distinction.
Read points 5 ('Demographics') and 6 ('Psychographics') under the section 'Retail site selection criteria: 8 factors to consider'.
For your beauty mini-market, psychographic data helps answer questions like:
- Do consumers in this area value wellness, self-care, and premium products?
- Are they early adopters of new beauty trends?
- Do they prefer shopping at small, local boutiques over large chains?
This data is harder to find in standard reports but can be inferred by observing the types of other businesses in the area (e.g., yoga studios, organic cafes, independent fashion boutiques).
3. The Science of Foot Traffic Analysis
Foot traffic is the lifeblood of a physical store. Analyzing it is more than just counting heads; it's about understanding the flow, timing, and quality of potential customers passing your door.
Retail Foot Traffic Analysis: A Comprehensive Guide
To understand this topic in detail, let's consult the 'Retail Foot Traffic Analysis' guide from AlphaMap. It provides a comprehensive overview of what foot traffic analysis is, where the data comes from, and what metrics to track.
Please read the following sections: 'What is Retail Foot Traffic Analysis?', 'Where Does Foot Traffic Data Come From?', and 'Key Foot Traffic Metrics to Analyze'.
How to Collect Foot Traffic Data
As the article mentions, there are two main approaches:
-
Traditional (Manual) Methods: For a new entrepreneur, this is the most accessible method. It involves visiting a potential location and manually counting passersby.
- Best Practice: Don't just go once. Visit during different times and days that are critical for your business. For a beauty store, you might check:
- A weekday lunch hour (12-2 PM)
- A weekday evening (5-7 PM)
- A Saturday afternoon (1-4 PM)
- This hands-on observation also gives you a feel for the psychographics of the people in the area.
- Best Practice: Don't just go once. Visit during different times and days that are critical for your business. For a beauty store, you might check:
-
Modern Methods (Data Providers): Companies like Pass_By and AlphaMap use anonymized mobile GPS data to provide highly accurate foot traffic counts, demographic profiles of visitors, and even data on where else those visitors shop. Commercial real estate brokers often provide these reports as part of their service.
Key Metrics and Influencing Factors
When you analyze foot traffic, you're looking for patterns. Here is a systematic process for conducting this analysis.
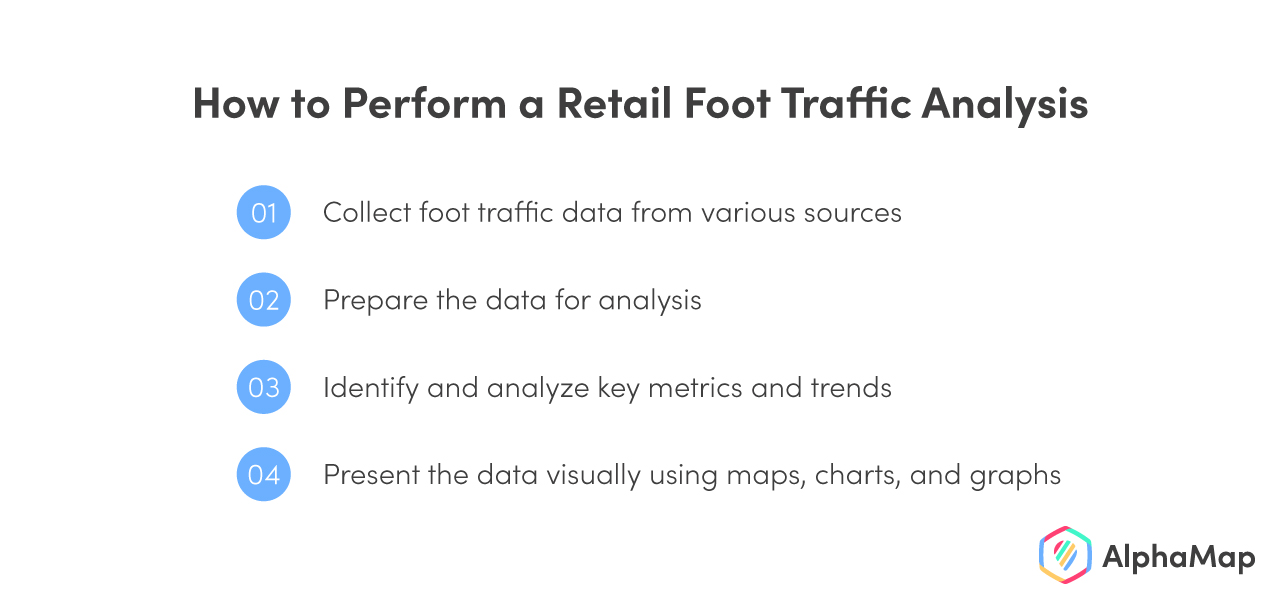
Let's focus on Step 3: analyzing key metrics.
- Foot Traffic Volume & Trends: Is the traffic consistent, or does it spike at certain times? The concept of 'day parts' is crucial here. You need to know if the location is busy during your potential peak operating hours.
- Physical Influencers: High traffic counts on a street don't automatically translate to customers in your store. Accessibility is key.
Finding the PERFECT location for your business | Business 101
Let's return to the 'Finding the PERFECT location' video. The second half demonstrates perfectly how physical factors can dramatically impact a location's true potential, even when the raw traffic numbers look good.
Watch the segment from 05:39 to 08:56. The presenter compares two sites on the same high-traffic road. Notice how the presence of a red light and ease of entry completely changes his assessment of the location's value.
This highlights that you must assess not just the quantity of traffic, but the quality of access. Ask yourself:
- How fast is the car traffic moving?
- Is there a traffic light or stop sign that slows people down and lets them see your store?
- How easy is it to turn into the shopping center or find parking?
4. Visualizing the Data for Decision-Making
Ultimately, the goal of collecting all this data is to compare potential locations side-by-side. Modern analytics platforms, similar to the ones you've likely used in digital marketing, allow you to visualize this data on a map.

This image demonstrates the end goal of your assessment. Whether you use a sophisticated tool like this through a broker or create a more basic version yourself with Google Maps and a spreadsheet, the principle is the same: you are layering data to make a comparative, evidence-based decision. You're no longer guessing; you're analyzing.
Conclusion
In this lesson, we transitioned from a qualitative checklist to a quantitative assessment of potential retail locations. By harnessing demographic data and foot traffic analysis, you can significantly de-risk the most important decision for a new retail business.
Key Takeaways:
- Framework is Key: A solid location rests on four pillars: physical site, demographics, trade area, and competition.
- Demographics Define Your Market: Analyze population density, income levels, and daytime population to ensure your target customer is present.
- Foot Traffic is More Than a Number: It's about understanding volume, trends over time (day parts), and the quality of customer access to the site.
- Analyze Systematically: Follow a process of collecting, preparing, analyzing, and visualizing data to compare locations objectively.
- Data Empowers You: Understanding these metrics allows you to have informed, strategic conversations with real estate brokers and make a final decision based on evidence, not just emotion.
Preview of the Next Lesson:
You now know how to identify and assess a promising location. But finding the perfect spot is only half the battle. The next step involves securing it. In our next lesson, we will begin to demystify the legal process by learning how to identify key terms in a commercial lease agreement.