Hello! Welcome to your next lesson in the "Core Java & JVM Internals" module.
In our last session, we explored the JVM's memory structure, including the generational heap and the Java Memory Model. We discussed how garbage collectors like G1 and ZGC work to manage the heap efficiently. Today, we'll examine what happens when that management fails or when memory resources are exhausted.
This lesson directly addresses a critical skill for any senior developer: diagnosing common JVM errors like OutOfMemoryError and StackOverflowError and explaining their causes. In interviews at top tech firms, you'll often face scenario-based questions like, "Your production service is crashing. The logs show an OutOfMemoryError. What do you do?" This lesson will equip you with a structured approach to answer that question confidently.
1. StackOverflowError: When the Call Stack Runs Too Deep
Let's start with the simpler of the two errors. As we reviewed in the previous lesson, each thread in a Java application has its own stack. The stack is used to store frames for each method call, holding local variables and references to objects on the heap. It operates on a Last-In, First-Out (LIFO) basis.
A java.lang.StackOverflowError occurs when a thread's call stack grows so large that it exhausts the memory allocated to it.
Stack Memory and StackOverFlowError in Java - Interview Question
To see this in action, the following video by Naveen AutomationLabs provides an excellent visual explanation of stack memory and how a StackOverflowError is triggered.
Watch the following two segments: 00:42 - 05:06: Pay attention to the visualization of how method calls (m1, m2, m3) are pushed onto and popped off the stack. This reinforces the LIFO principle. 05:06 - 13:11: This part explains what happens when the stack fills up and demonstrates the most common cause: uncontrolled recursion. Observe the debug view showing the stack growing infinitely.
Causes and Diagnosis
The overwhelming cause of a StackOverflowError is infinite or excessively deep recursion. This happens when a method calls itself without a proper termination condition (a "base case").
How to Diagnose:
The stack trace of the error is your primary tool. It will clearly show the same sequence of method calls repeating over and over again until the JVM gives up.
For example:
Exception in thread "main" java.lang.StackOverflowError
	at com.example.MyClass.recursiveMethod(MyClass.java:10)
	at com.example.MyClass.recursiveMethod(MyClass.java:10)
	at com.example.MyClass.recursiveMethod(MyClass.java:10)
	...
Solutions
-
Fix the Code (Primary Solution): The correct solution in almost all cases is to debug your code and fix the faulty logic. Find the recursive method and ensure it has a base case that will eventually be met.
-
Increase Stack Size (Use with Caution): In rare cases, an application might have a legitimate need for very deep recursion (e.g., traversing a very deep tree structure). If you've confirmed the logic is correct, you can increase the thread stack size using the
-XssJVM argument. For example,-Xss2msets the stack size to 2 megabytes.
Stack Memory and StackOverFlowError in Java - Interview Question
Let's return to the video to see how to apply the -Xss flag. This is a practical skill for configuring JVMs in production.
Watch from 18:20 to 21:52. The presenter demonstrates how to add the -Xss VM argument in an IDE and shows that it can resolve the error by providing more stack space.
It's crucial to understand that increasing stack size without fixing a bug is just a temporary fix that masks the underlying problem and wastes memory.
Test your understanding!
Consider the following function designed to calculate a factorial. What bug in this code will cause a StackOverflowError, and how would you fix it?
public long factorial(int n) {
    if (n == 0) {
        return 1;
    }
    return n * factorial(n); // What's wrong here?
}
Show answer
The bug is in the recursive call: factorial(n). It should be factorial(n - 1).
The current code will result in an infinite recursion (factorial(5) calls factorial(5), which calls factorial(5), and so on), never reaching the base case n == 0. This will quickly fill the stack and throw a StackOverflowError.
The fix:
public long factorial(int n) {
    if (n < 0) { // Good practice to handle negative input
        throw new IllegalArgumentException("Factorial not defined for negative numbers");
    }
    if (n == 0) {
        return 1;
    }
    return n * factorial(n - 1); // Corrected recursive call
}
2. OutOfMemoryError: When the Heap is Tapped Out
Unlike the relatively straightforward StackOverflowError, java.lang.OutOfMemoryError (OOME) is a class of errors with multiple variations, each pointing to a different underlying problem.

For your interviews, you should be deeply familiar with the three most common types.
A. OutOfMemoryError: Java heap space
This is the most frequent OOME. It occurs when the JVM tries to allocate an object on the heap, but there isn't enough space, and the Garbage Collector cannot free up enough memory to satisfy the request.
The JVM Troubleshooting Guide provides a clear, practical overview of this error, its causes, and a high-level troubleshooting plan. This mirrors the process you'd follow in a real production scenario.
Read the section titled 'OutOfMemoryError: Java heap space - what is it?'. Focus on the two primary causes (undersized heap vs. memory leak) and the recommended diagnostic steps, especially the use of verbose GC and the -XX:+HeapDumpOnOutOfMemoryError flag.
As the guide explains, there are two main culprits:
- Memory Leak: This is the more insidious problem. Objects that are no longer needed are still referenced somewhere in your application, preventing the GC from reclaiming them. Over time, these objects accumulate in the Old Generation until it's completely full.
- Undersized Heap: The application genuinely needs more memory than the heap is configured to provide. This might happen due to a sudden spike in traffic or processing a particularly large data set.
The Diagnostic Process: A Step-by-Step Guide
This is the structured response interviewers are looking for.
Step 1: Gather Data Automatically
Configure your production JVMs with these essential flags:
-XX:+HeapDumpOnOutOfMemoryError: This tells the JVM to automatically generate a heap dump file when an OOME occurs. A heap dump is a snapshot of all objects on the heap at that moment.-XX:HeapDumpPath=/path/to/dumps/: Specifies where to save the heap dump file.-Xlog:gc*:file=gc.log: Enables detailed GC logging to a file. This helps you analyze memory usage patterns leading up to the crash.
Step 2: Analyze the Heap Dump
This is the core of the investigation. The heap dump file, which can be several gigabytes, is analyzed using a tool like Eclipse Memory Analyzer Tool (MAT) or VisualVM.
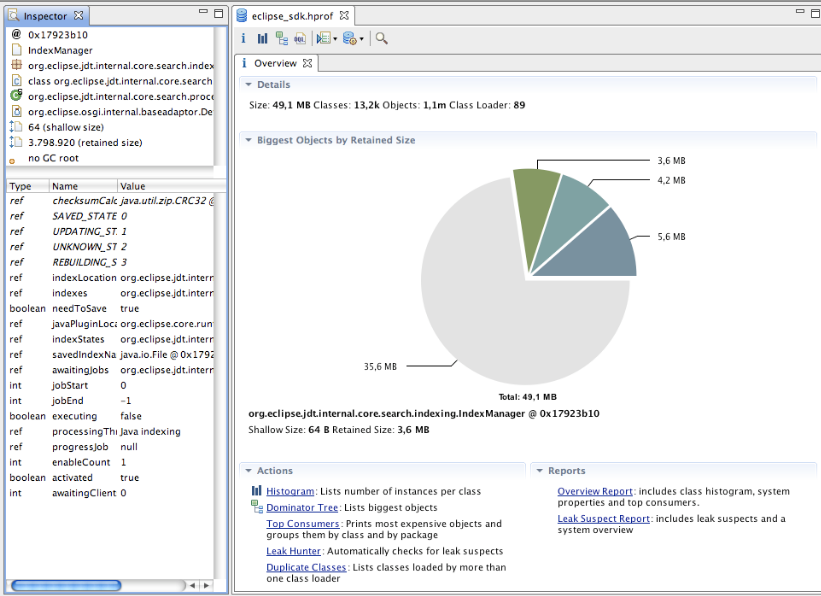
When you open a heap dump in MAT, you're looking for:
- Leak Suspects Report: MAT can often automatically identify potential memory leaks.
- Dominator Tree: This view shows you which objects are "dominating" memory—that is, which objects are holding on to the largest amount of memory through their references. This is invaluable for tracing a leak back to its root.
- Histogram: Shows the number of instances and total size for each class, helping you spot unusual accumulations of certain object types.
Step 3: Correlate with GC Logs
Analyze the GC logs from the time leading up to the OOME.
- If you see the Old Generation usage steadily climbing over time, even after Full GCs, it strongly suggests a memory leak.
- If heap usage is generally stable but a sudden spike causes the crash, it might be an undersized heap or a specific, memory-intensive operation.
By combining heap dump analysis with GC logs, you can definitively determine the root cause and fix it—either by plugging the memory leak in your code or by appropriately tuning the heap size (-Xmx).
B. OutOfMemoryError: GC overhead limit exceeded
This is a specific variant of a heap space error. The JVM throws this if it's spending more than 98% of its time doing garbage collection and is recovering less than 2% of the heap. In short, the application is grinding to a halt, making virtually no progress because it's constantly trying—and failing—to free up memory.
The JVM Troubleshooting Guide has another excellent section that explains this specific error, its purpose, and how to approach it.
Read the section 'GC overhead limit exceeded – Analysis and Patterns'. Note that the root cause is still a heap problem, and the diagnostic steps (heap dumps, GC logs) are the same as for a standard Java heap space error.
The key takeaway is that this error is a symptom of a full heap. Treat its diagnosis exactly like you would for a Java heap space OOME.
C. OutOfMemoryError: unable to create new native thread
This error is fundamentally different because it's not about the Java heap. It's about native memory—the memory the OS gives to the JVM process itself.
The JVM throws this error when it asks the operating system to create a new thread, and the OS refuses.
Understanding this error requires thinking beyond the heap. This section from the guide provides critical context, especially the difference in causes between 32-bit and 64-bit JVMs.
Read the section 'OutOfMemoryError: unable to create new native thread'. Focus on the root causes: OS process limits (ulimit), OS memory depletion, and how a large Java heap on a 32-bit JVM can squeeze out the available native memory for threads.
Common Causes:
- Process Thread Limit Reached: The operating system imposes a limit on the number of threads a single process can create. You may have hit this limit (check with
ulimit -uon Linux). - System Memory Exhaustion: The OS is out of RAM and swap space to allocate the memory required for a new thread's stack. Each thread requires its own stack space (defined by
-Xss), which is allocated from native memory. - Thread Leak: Your application is creating threads but never shutting them down properly. Over time, the thread count grows until it hits an OS limit.
Diagnosis:
- Monitor Thread Count: Use tools like
jstack <pid>to take a thread dump and count the number of active threads.jstack <pid> | wc -lgives a quick count. Is the number abnormally high or constantly growing? - Check OS Limits: Consult your system administrator or use
ulimit -ato check the maximum user processes allowed. - Monitor System Memory: Use OS-level tools (
top,free,htop) to check the overall memory usage on the machine. Is another process consuming all the memory?
The solution usually involves fixing a thread leak in the code, increasing OS-level limits, or reducing the thread stack size (-Xss) if it's unnecessarily large.
Test your understanding!
An interviewer asks: "Your service, running in a Docker container with a 2GB memory limit, just crashed with an OutOfMemoryError: unable to create new native thread. The Java heap is set to -Xmx1g. What are two possible causes, and how would you investigate them?"
Show answer
This is a classic container-related scenario. The key is that the total memory used by the JVM process (Heap + Metaspace + Thread Stacks + other native memory) must fit within the container's 2GB limit.
Possible Cause 1: Thread Leak or Excessive Thread Creation
The application might be creating too many threads. Each thread's stack consumes native memory (e.g., 1MB per thread by default). If the application creates, say, 800 threads, that alone would consume 800MB of native memory. Combined with the 1GB heap and other overhead, this could easily exceed the 2GB container limit, preventing the OS from creating any more threads.
- Investigation:
- Get a shell into a running instance of the container (or a new one).
- Use
jstack <pid>to generate a thread dump. - Analyze the thread dump to count the number of threads and identify what they are doing. An unusually high number of threads in a
TIMED_WAITINGorBLOCKEDstate might indicate a leak or a misconfigured thread pool.
Possible Cause 2: Unconstrained Native Memory Growth (e.g., Direct Buffers)
The Java heap is limited to 1GB, but other parts of native memory are not. For example, if the application uses ByteBuffer.allocateDirect(), this memory is allocated outside the Java heap. If this usage is unbounded, it could consume the remaining 1GB of memory in the container, leaving no room for new thread stacks.
- Investigation:
- Enable native memory tracking with
-XX:NativeMemoryTracking=summary. - Use
jcmd <pid> VM.native_memory summaryto get a breakdown of where the JVM is allocating native memory. This will explicitly show if memory for threads, direct buffers (Internal), or other areas is growing uncontrollably.
- Enable native memory tracking with
Conclusion
Mastering JVM error diagnosis is a hallmark of a senior engineer. It demonstrates a deep understanding of how the JVM interacts with the underlying system and shows you can handle high-pressure production issues methodically.
Key Takeaways:
StackOverflowErroris a stack issue, usually from infinite recursion. The fix is almost always in the code.OutOfMemoryError: Java heap spaceis a heap issue, caused by memory leaks or an undersized heap. Your primary diagnostic tools are heap dumps and GC logs.OutOfMemoryError: unable to create new native threadis a native memory issue, caused by OS limits or overall system memory exhaustion. Diagnose with thread dumps and OS-level monitoring.- A Structured Approach is Key: For any
OutOfMemoryError, the process is the same: enable logging (-XX:+HeapDumpOnOutOfMemoryError), collect the artifacts (dump files, logs), analyze them with the right tools (MAT,jstack), and form a hypothesis to guide your fix.
In our next lesson, we'll shift back to a core Java concept and explore the difference between primitive types and wrapper classes, including the subtle but important performance implications of autoboxing.