Hello! Welcome to your next lesson in the "Core Java & JVM Internals" module.
In our last session, we dug into the equals() and hashCode() contract, understanding how crucial it is for objects stored in hash-based collections on the Java heap. Today, we will zoom out from individual objects to examine the entire memory landscape they inhabit.
This lesson addresses a fundamental topic for any senior Java developer: the Java memory architecture. Our learning outcome is to explain the Java Memory Model (JMM), heap structure, and the goals of modern garbage collectors (e.g., G1, ZGC). Understanding these concepts is non-negotiable for diagnosing performance bottlenecks, memory leaks, and complex concurrency bugs—all common themes in FAANG and Fintech interviews.
1. The Lay of the Land: JVM Memory Structure
When a Java application runs, the JVM carves out several distinct memory areas in RAM. While you've likely heard of the "heap" and "stack," it's important to have a precise mental model of all the components.
These runtime data areas include:
- Heap Memory: Shared by all threads. This is where all your objects (
new Employee(), arrays, etc.) live. We'll explore this in detail. - Stack Memory: Each thread gets its own stack. A stack stores frames for each method call, holding local variables and references to objects on the heap.
- Metaspace (since Java 8): Stores class metadata, like the structure of a class, its methods, and fields. It resides in native memory. This replaced the older "Permanent Generation" (PermGen) space.
- Program Counter (PC) Register: Each thread has one. It holds the address of the currently executing JVM instruction.
- Native Method Stack: Used for native (non-Java) code, typically written in C/C++.
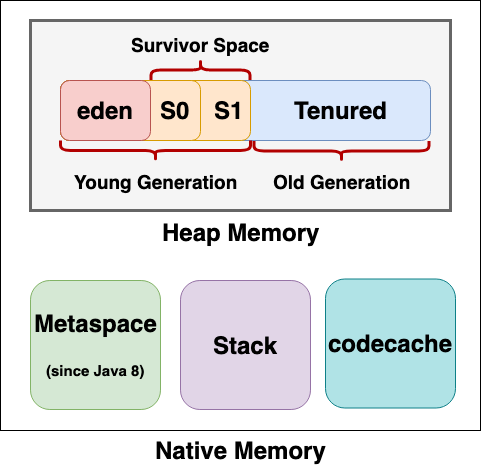
Today, our main focus is on the Heap, as it's the largest and most dynamic memory area, directly managed by the Garbage Collector.
2. A Closer Look at the Heap: The Generational Hypothesis
The heap isn't just one big, unorganized space. It's structured to optimize garbage collection, based on a simple observation known as the weak generational hypothesis:
- Most objects die young.
- Objects that survive for a while are likely to live for a long time.
To leverage this, the heap is divided into two main parts: the Young Generation and the Old Generation.
9. Java Memory Management and Garbage Collection in Depth
To see how objects move through these generations, watch the following segment from the video 'Java Memory Management and Garbage Collection in Depth' by Concept && Coding. It provides an excellent, step-by-step visualization of the process.
Watch from 27:02 to 40:19. Focus on how a new object is first placed in 'Eden' space, how it moves to a 'Survivor' space after a 'Minor GC', and how it is eventually 'promoted' to the 'Old Generation' after surviving multiple GC cycles.
Let's summarize the key stages you just saw:
The Young Generation
This is where all new objects are born. It's designed for fast allocation and frequent, quick garbage collections. It's further subdivided into:
- Eden Space: When you write
new MyObject(), the memory is allocated here. - Survivor Spaces (S0 and S1): Two identical spaces.
The process works like this:
- New objects are allocated in Eden.
- When Eden fills up, a Minor GC is triggered. All application threads are paused (this is a "stop-the-world" event, but it's usually very brief).
- The GC identifies "live" objects (those still referenced). These are moved from Eden to one of the survivor spaces (say, S1). Dead objects are simply discarded.
- On the next Minor GC, live objects from Eden and from the other survivor space (S0) are copied to S1.
- With each survival, an object's "age" is incremented.
The Old (or Tenured) Generation
This space is for long-lived objects. An object is promoted from the Young Generation to the Old Generation when its age reaches a certain threshold (defined by -XX:MaxTenuringThreshold).
Garbage collection in the Old Generation is called a Major GC. A Full GC cleans the entire heap (both Young and Old Generations). These events are less frequent but much more costly, as they often involve longer "stop-the-world" pauses. A key goal of GC tuning is to minimize the frequency and duration of Full GCs.
3. The Janitors: Garbage Collection Goals & Algorithms
The JVM provides several garbage collectors, each with different performance characteristics. Choosing the right one is about understanding the trade-offs, primarily between throughput and latency.
- Throughput: The total amount of work your application can do over a period, ignoring pauses. High-throughput GCs maximize processing power but may have longer GC pauses.
- Latency: The responsiveness of your application. Low-latency GCs aim to keep pauses as short and predictable as possible, even if it means using more CPU for GC tasks.
This article from DigitalOcean provides a fantastic, in-depth comparison of the most important GC algorithms. It's a must-read to understand their goals and trade-offs.
Read the section 'Garbage Collection in Java'. Pay close attention to the descriptions of Serial GC, Parallel GC, G1 GC, and ZGC. The summary table at the end of the section is especially useful for interview preparation.
Here's a quick summary of the collectors you should know for a senior-level interview:
| Collector | Default In | Key Goal & Characteristic | Best Use Case |
|---|---|---|---|
| Parallel GC | Java 8 | High Throughput. Uses multiple threads but pauses all application threads during collection. Pauses can be long on large heaps. | Batch processing, scientific computing. |
| G1 GC | Java 9+ | Balanced. Aims for predictable pause times by dividing the heap into regions and collecting them incrementally. A great default choice. | Most server-side applications, large heaps. |
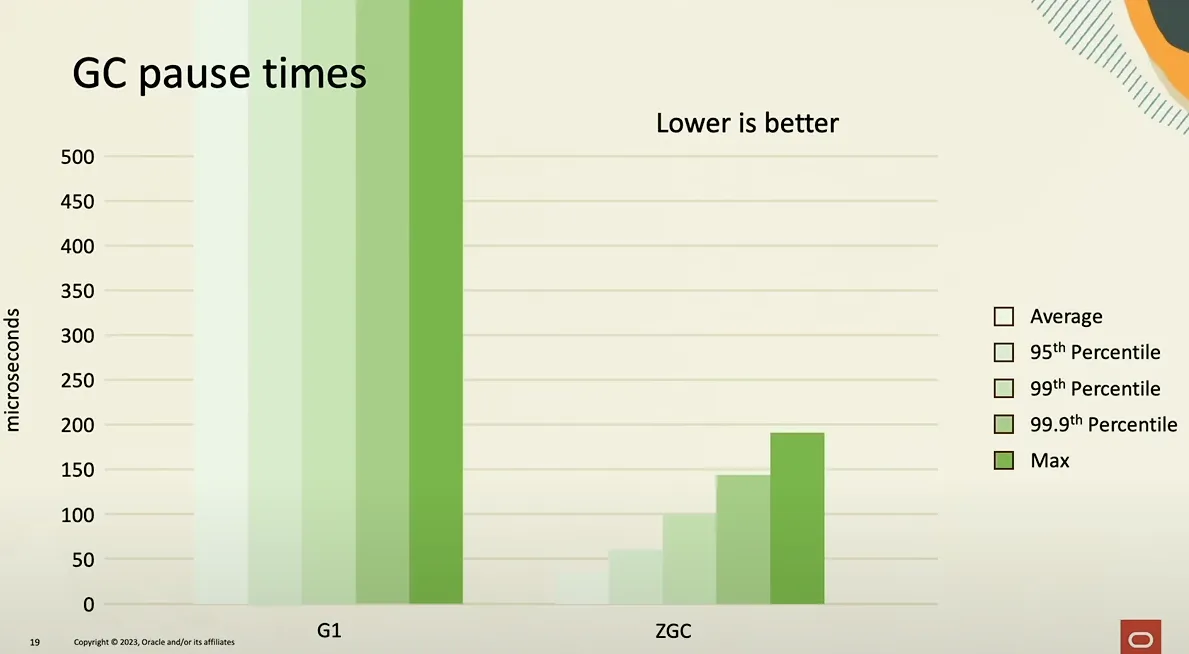
| ZGC | (Optional) | Ultra-Low Latency. Keeps pauses under a few milliseconds, regardless of heap size, by doing almost all work concurrently. | Real-time services, financial trading systems. |
| Shenandoah | (Optional) | Ultra-Low Latency. Similar goals to ZGC, with a different technical implementation (e.g., it supports concurrent compaction). | Latency-sensitive microservices. |
Test your understanding!
An interviewer tells you: "Our flagship application, running on Java 8, experiences periodic, long freezes where it becomes completely unresponsive. We've noticed this happens on our production servers, which have 32 GB of heap space. What is the most likely cause, and what would be your first recommendation to investigate?"
Show answer
Likely Cause:
The application is likely using the Parallel Garbage Collector, which is the default in Java 8. While excellent for throughput, it performs "stop-the-world" Full GCs to clean the Old Generation. On a large 32 GB heap, these pauses can easily last for several seconds, causing the application to "freeze."
First Recommendation:
- Switch the Garbage Collector: My first recommendation would be to switch to the G1 Garbage Collector by adding the JVM flag
-XX:+UseG1GC. G1 is designed to handle large heaps with more predictable and generally shorter pause times, which should immediately alleviate the long freezes. - Enable GC Logging: Concurrently, I would enable detailed GC logging with
-Xlog:gc*:file=gc.log(for Java 9+) or-XX:+PrintGCDetails -Xloggc:gc.log(for Java 8). Analyzing these logs would allow us to confirm the long pause times with the Parallel GC and quantify the improvement after switching to G1, paving the way for further tuning if needed.
4. The Rules of Concurrency: The Java Memory Model (JMM)
So far, we've discussed the structure of memory. But what happens when multiple threads access that memory, specifically the shared heap? This is where the Java Memory Model (JMM) comes in.
The JMM is a specification that defines the rules for how and when changes to shared variables made by one thread are visible to other threads.
The Problem:
Modern hardware is complex. To improve performance, CPUs use local caches, and both compilers and CPUs can reorder instructions. This means:
- A thread might be working with a stale value from its local cache, not the "true" value in main memory.
- The order of operations you see in your code might not be the order in which they actually execute.
Without the JMM, multithreaded programming would be chaos. You could never be sure if one thread would see the work of another.
The Java Memory Model - The Basics
This video from Jakob Jenkov provides a great introduction to the JMM. It explains how memory is organized with respect to threads and how hardware architecture leads to concurrency problems.
Watch the following segments: 00:00 - 02:54: This explains the fundamental split between the thread-local stack and the shared heap. 10:49 - 18:09: This connects the JVM memory layout to hardware (CPUs, caches, RAM) and explains how this leads to visibility problems and race conditions. It also introduces volatile and synchronized as solutions.
The Happens-Before Guarantee
The JMM provides a crucial concept called the happens-before relationship. It's a formal guarantee: if Action A happens-before Action B, then the results of A (e.g., writing to a variable) are guaranteed to be visible to Action B.
You don't need to manage this manually. You establish happens-before relationships by using Java's concurrency constructs:
synchronizedblocks: An unlock on a monitor happens-before any subsequent lock on that same monitor.volatilevariables: A write to avolatilevariable happens-before any subsequent read of that same variable. This keyword essentially tells the JVM "don't cache this variable, always read/write from main memory."Thread.start(): All actions in a thread before callingstart()on a new thread happen-before any action in the new thread.Thread.join(): All actions in a thread that has terminated happen-before thejoin()method returns in another thread.
Understanding Memory Visibility and Happens-Before ...
For a concise definition and practical examples of the 'happens-before' relationship, read the following sections from this article.
Read the sections 'The Problem: CPU Caching and Reordering' and 'The Happens-Before Relationship'. Focus on the formal definition and the examples of how volatile and synchronized create these guarantees.
In an interview, being able to explain that the JMM exists to solve visibility and ordering issues caused by hardware/compiler optimizations, and that it provides this guarantee via happens-before relationships established by keywords like volatile and synchronized, demonstrates a deep level of understanding.
Conclusion
Today we've covered a lot of ground, moving from the physical layout of JVM memory to the abstract rules that govern concurrent access. Mastering these topics separates a mid-level developer from a senior one.
Key Takeaways:
- Heap Structure: The heap is divided into Young (Eden, S0, S1) and Old Generations to optimize GC based on object lifecycles. New objects are born in Eden and are promoted to the Old Gen if they live long enough.
- Garbage Collectors: Modern GCs like G1 and ZGC prioritize low, predictable pause times (latency) over raw processing power (throughput), which is crucial for responsive server-side applications.
- The JMM: It's a specification that ensures memory consistency across threads in the face of hardware optimizations. It provides this guarantee through the
happens-beforerelationship. - Synchronization Primitives: Keywords like
volatileandsynchronizeddo more than just control access; they are crucial for ensuring memory visibility between threads by establishinghappens-beforerelationships.
In our next lesson, we will apply this knowledge to diagnose common JVM errors like OutOfMemoryError and StackOverflowError, exploring what causes them and how to debug them.