Hello! Welcome back to your course on interview preparation for Core Java, Spring Boot, and Microservices.
In our last session, we clarified the roles of the JDK, JRE, and JVM, establishing the JVM as the core engine that executes Java bytecode. You learned that the JDK is for development, the JRE is for running applications, and the JVM is the platform-specific component that makes "Write Once, Run Anywhere" a reality.
Today, we're going to open up that JVM "black box." This lesson directly addresses the learning outcome: Describe the JVM's runtime data areas, class loading mechanism, and execution engine. Understanding this internal architecture is a key differentiator in senior-level interviews. It demonstrates a fundamental grasp of the platform that goes beyond simply writing code and is crucial for diagnosing complex runtime issues like memory leaks or performance bottlenecks.
The Three Pillars of the JVM
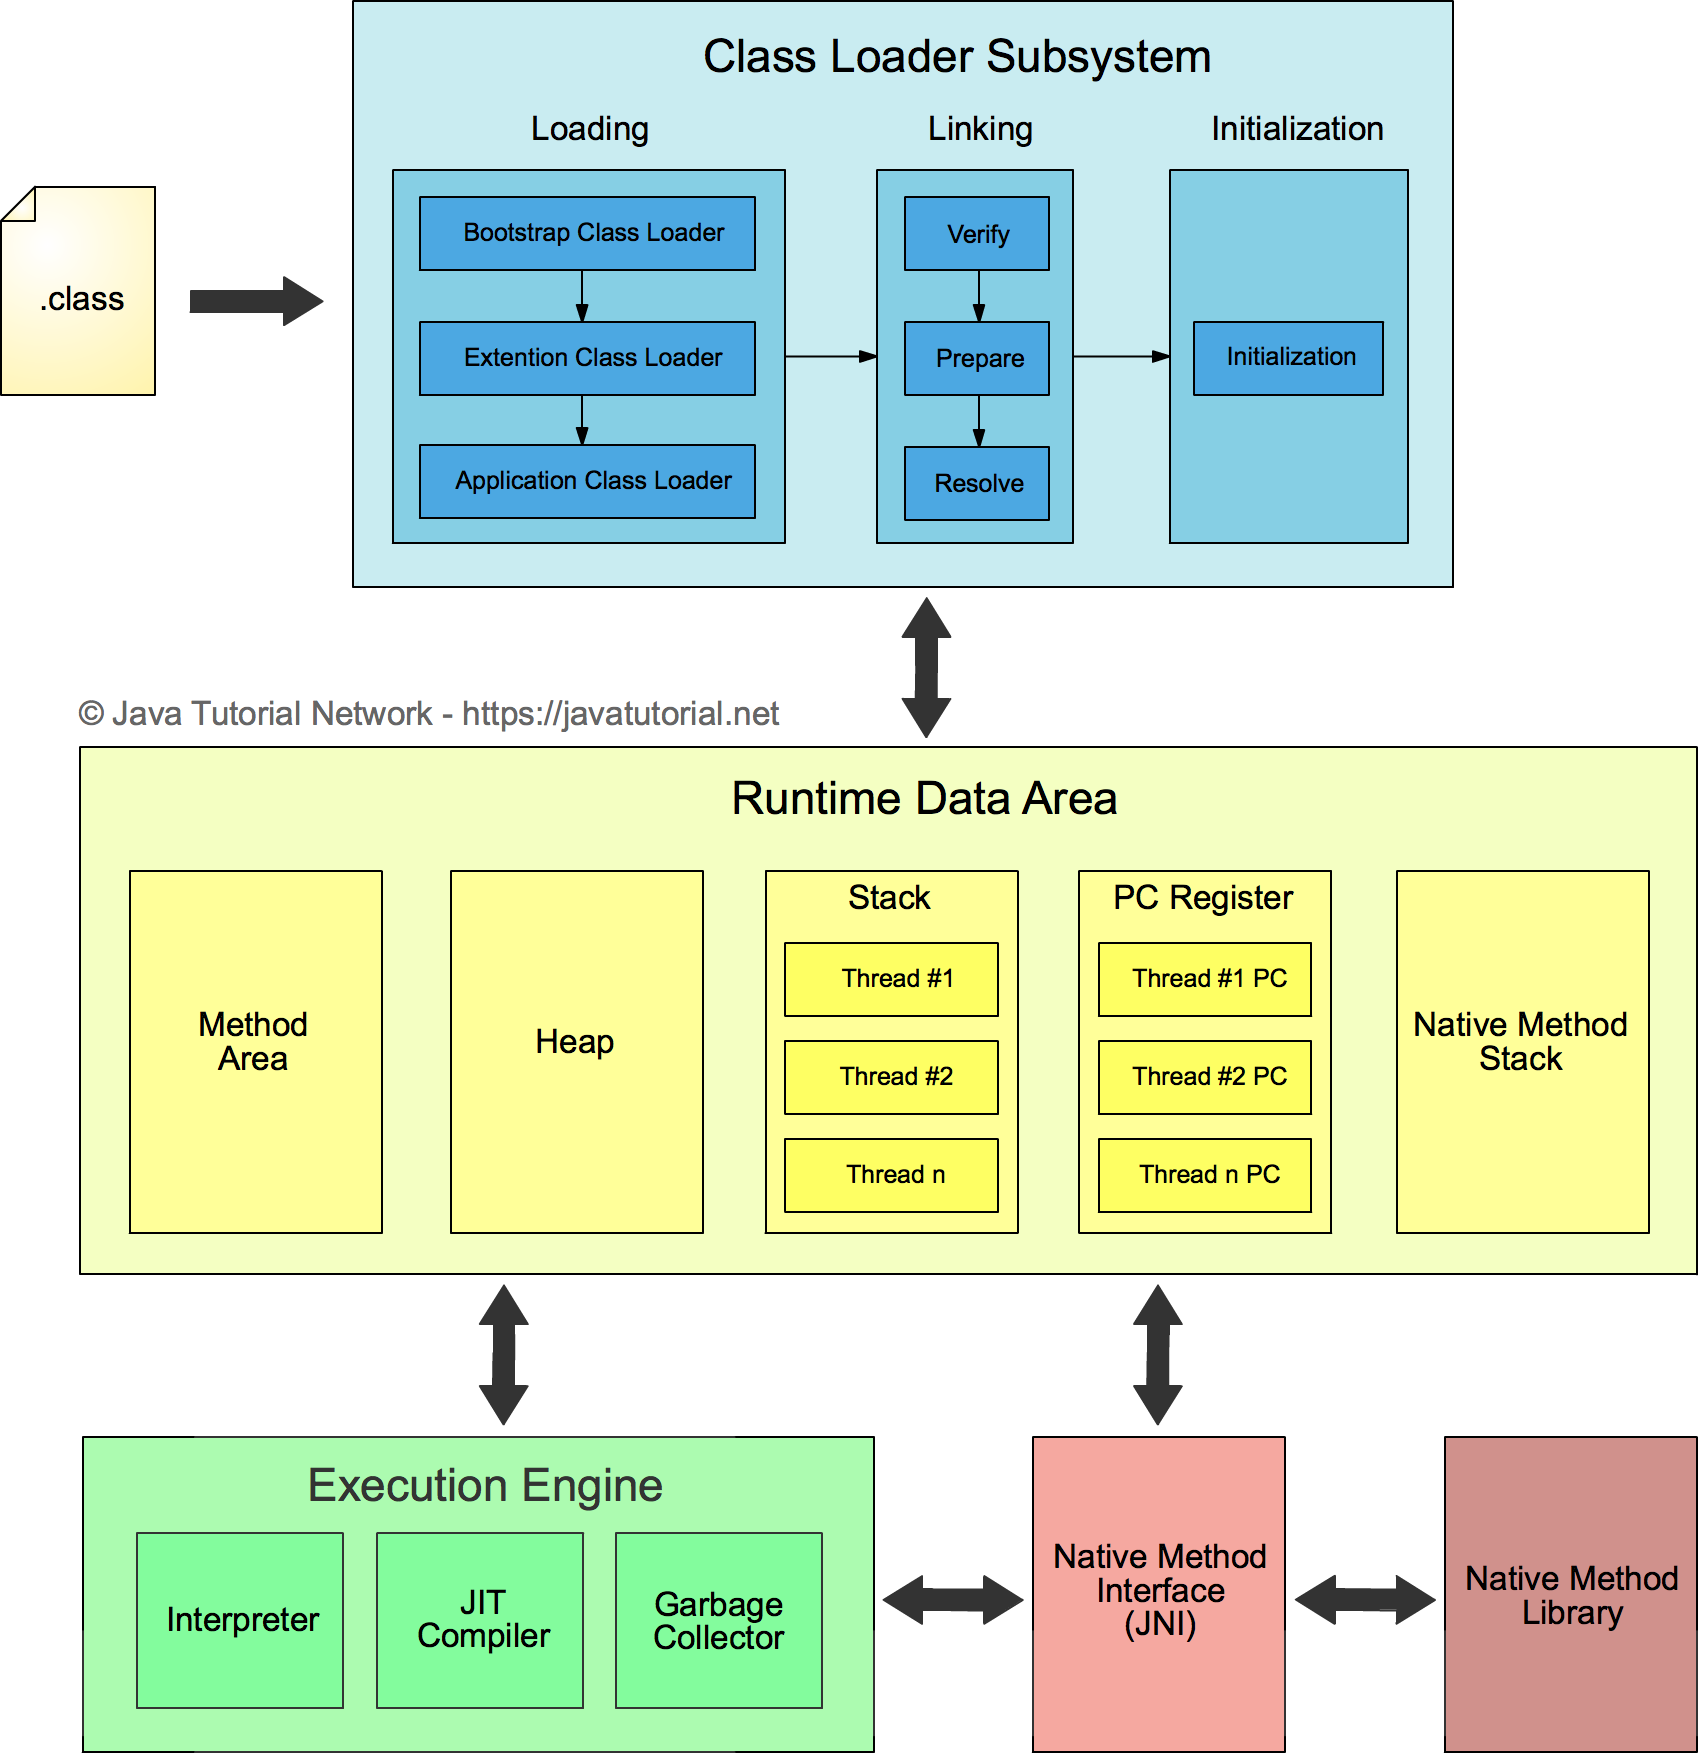
At a high level, the JVM's architecture is composed of three main subsystems that work together to run your compiled Java code.
- Class Loader Subsystem: Responsible for finding, loading, and preparing your class files.
- Runtime Data Areas: The memory model of the JVM, where all data is stored during execution.
- Execution Engine: Responsible for actually executing the bytecode.
This diagram provides a great mental map of how these components are organized. We will refer back to it as we explore each part in detail.
Let's dive into each of these subsystems.
1. Class Loader Subsystem
Before the JVM can run any code, it must first load the necessary classes. This is the job of the Class Loader Subsystem, which performs this task in three phases: Loading, Linking, and Initialization.
To get a comprehensive overview of this process, let's watch a segment from the "JVM architecture" tutorial.
JVM ( java virtual machine) architecture - tutorial
This section of the video breaks down the entire class loading process, from the three types of class loaders to the detailed steps of linking and initialization.
Watch the video from 04:00 to 12:35. Pay close attention to: The delegation model involving the Bootstrap, Extension (now Platform), and Application class loaders. The three phases: Loading, Linking (Verify, Prepare, Resolve), and Initialization. The distinction between what happens during the 'Prepare' phase (memory allocation with default values) and the 'Initialize' phase (assignment of actual values).
Let's summarize the key points from the video:
-
Loading: This phase finds the
.classfile on disk (or network) and brings its bytecode into the Method Area. The JVM uses a delegation hierarchy of class loaders:- Bootstrap Class Loader: Loads core Java API classes (like
String,Object) fromrt.jar. It's the "parent" of all others and is implemented in native code. - Extension Class Loader (renamed Platform Class Loader in Java 9+): Loads classes from the JRE's extension directory.
- Application (or System) Class Loader: Loads the classes from your application's classpath.
- Bootstrap Class Loader: Loads core Java API classes (like
-
Linking: This phase makes the class ready for execution.
- Verification: A security step. The bytecode verifier checks that the
.classfile is valid and won't compromise the JVM. If it fails, you get aVerifyError. - Preparation: The JVM allocates memory for static variables and initializes them with their default values (e.g.,
0forint,falseforboolean,nullfor objects). - Resolution: The JVM replaces symbolic references in the code (like class names) with actual direct memory references.
- Verification: A security step. The bytecode verifier checks that the
-
Initialization: This is the final step. The initial values specified in your code are assigned to static variables, and any
staticblocks are executed. This phase is triggered only when the class is first actively used (e.g., by creating an instance or calling a static method).
Test your understanding!
An interviewer asks: "What is the difference between a ClassNotFoundException and a NoClassDefFoundError?" How would you explain it based on the class loading mechanism?
Show answer
The difference lies in when the class is missing.
-
A
ClassNotFoundExceptionis thrown when you try to load a class at runtime using reflection (e.g.,Class.forName()) or dynamic class loading, but the class file cannot be found on the classpath. This happens during the Loading phase when the class loader actively tries to locate the file and fails. -
A
NoClassDefFoundErroris anErrorthat occurs when a class was successfully loaded by the class loader earlier, but is somehow unavailable during runtime when it's needed. This typically happens if an exception occurred during the Initialization phase (e.g., in astaticblock) of that class. The class is now in a broken state, and any subsequent attempt to use it will result in this error. It can also happen if a class was present at compile time but missing from the classpath at runtime.
In short: ClassNotFoundException = "I tried to find it and couldn't." NoClassDefFoundError = "I found it before, but now it's broken or gone when I need to use it."
2. Runtime Data Areas
Once classes are loaded, the JVM needs a place to store data and instructions. These are the Runtime Data Areas, essentially the memory of the JVM. Some areas are shared among all threads, while others are private to each thread.
The following segments of the video we started earlier explain these memory areas clearly.
JVM ( java virtual machine) architecture - tutorial
These sections of the video detail the five major runtime data areas, separating them into those shared by the JVM and those created per thread.
Watch the video from 12:35 to 22:55. Focus on: Shared areas: Method Area (Metaspace) and Heap. Note what kind of data goes into each. Per-thread areas: PC Register, Java Stack, and Native Method Stack. Understand why each thread needs its own. The cause of OutOfMemoryError (related to Heap/Metaspace) and StackOverflowError (related to the Stack).
Let's break down these areas, which are also shown in the architectural diagram at the start of the lesson.
Areas Shared by All Threads
-
Method Area:
- Stores per-class information such as class metadata, the runtime constant pool, field and method data, and the code for methods.
- Crucially, static variables are also stored here.
- Before Java 8, this was a fixed-size part of the heap called PermGen (Permanent Generation). Running out of space here caused an
OutOfMemoryError: PermGen space. - Since Java 8, PermGen has been replaced by Metaspace, which is allocated from native memory, not the Java heap. This makes it more flexible as it can grow automatically, reducing the frequency of that specific
OutOfMemoryError.
-
Heap Area:
- This is where all objects and arrays are allocated at runtime.
- It is the largest memory area and is managed by the Garbage Collector.
- When the heap runs out of space to allocate new objects, the JVM throws an
OutOfMemoryError: Java heap space.
Areas Private to Each Thread
When a new thread is created, it gets its own set of these three data areas. This isolation is a key reason why local variables are inherently thread-safe.
-
Java Stack:
- Stores stack frames. A new frame is created for each method invocation and destroyed when the method completes.
- Each stack frame contains:
- Local variables for that method.
- An operand stack (a workspace for intermediate calculations).
- A reference to the runtime constant pool.
- If a thread's computation requires a deeper stack than allowed, a
StackOverflowErroris thrown. This is common with unterminated recursive calls.
-
PC (Program Counter) Register:
- A very small memory area that holds the address of the JVM instruction currently being executed. Each thread has its own PC register to keep track of its own execution sequence.
-
Native Method Stack:
- Similar to the Java Stack, but used for native (non-Java) method invocations, such as code written in C/C++ and called via the Java Native Interface (JNI).
Test your understanding!
Consider the following code snippet:
public class MemoryExample {
    private static String staticField = "I'm static";
    private String instanceField = "I'm an instance";

    public void someMethod() {
        int localVariable = 100;
        MemoryExample anotherObject = new MemoryExample();
    }
}
If someMethod() is executed, in which runtime data areas would the following be located?
- The
staticFieldvariable - The
instanceFieldvariable of an object - The
localVariable - The
anotherObjectreference variable - The actual object that
anotherObjectrefers to
Show answer
staticField: In the Method Area (or Metaspace), because it is a static variable associated with theMemoryExampleclass itself.instanceField: In the Heap, as part of theMemoryExampleobject's data.localVariable: On the Java Stack, inside the stack frame forsomeMethod().anotherObjectreference: On the Java Stack, inside the stack frame forsomeMethod(). It's a local variable that holds a memory address.- The actual
MemoryExampleobject: In the Heap. TheanotherObjectreference on the stack points to this object in the heap.
3. Execution Engine
The Execution Engine is the component that reads the bytecode from the memory areas and executes it. It's the true "processor" of the JVM.
JVM ( java virtual machine) architecture - tutorial
This final clip from the tutorial introduces the main components of the Execution Engine.
Watch from 24:09 to 27:11. This will explain the roles of: The Interpreter. The Just-In-Time (JIT) Compiler. The Garbage Collector (GC) as a part of the engine.
The core components of the Execution Engine are:
-
Interpreter: Reads bytecode instruction by instruction, interprets it, and executes it. This is straightforward but relatively slow because the same method will be re-interpreted every time it's called.
-
Just-In-Time (JIT) Compiler: To improve performance, the JVM uses a JIT compiler. The JVM profiles the code as it runs, identifying "hotspots"—methods that are executed frequently. The JIT compiler then compiles these hotspots into highly optimized native machine code that can be executed directly by the CPU, bypassing the interpreter. This is why Java applications often "warm up" over time, getting faster after an initial period of interpretation and profiling.
-
Garbage Collector (GC): This component runs in the background to automatically find and reclaim memory from objects that are no longer referenced, freeing up space in the Heap. We will dedicate an entire future lesson to the GC, but for now, know that it's an essential part of the Execution Engine.
For a deeper perspective suited for senior-level interviews, it's useful to understand that the "Execution Engine" isn't just one thing, but a sophisticated system of interpretation and multiple levels of compilation.
This video from JetBrains, 'JVM Anatomy 101', offers a more nuanced look at how code is executed, discussing different types of interpreters and compilers. This level of detail is excellent for your interview preparation goals.
Watch the segment from 17:49 to 24:30. This covers the trade-offs between interpretation and compilation, and how modern JVMs use a combination of both for optimal performance. Note the discussion of simple vs. optimizing compilers.
Conclusion
You've now taken a detailed tour inside the JVM. This knowledge is not just academic; it's the foundation for understanding performance tuning, concurrency, and memory management in Java.
Let's summarize the key takeaways:
- JVM Architecture: Comprises the Class Loader Subsystem, Runtime Data Areas, and Execution Engine.
- Class Loading: A three-phase process (Load, Link, Initialize) that uses a delegation model to bring classes into the JVM.
- Runtime Data Areas: The JVM's memory is divided into the Heap (for objects), Method Area/Metaspace (for class data), and per-thread areas like the Java Stack (for local variables and method frames), PC Register, and Native Method Stack.
- Execution Engine: Uses a combination of a slow-but-simple Interpreter and a powerful JIT Compiler to execute bytecode efficiently, while the Garbage Collector manages memory automatically.
In our next lesson, we will focus on a very common interview topic: String, StringBuilder, and StringBuffer. We will explore string immutability and the String pool, a concept that directly relates to the Heap and Method Area we discussed today.