Hello! Welcome to our final lesson in the Microservices: Resilience & Observability module.
In our last two lessons, we explored two of the three pillars of observability. First, we implemented distributed tracing with Micrometer and Zipkin to understand the journey of individual requests. Then, we added custom metrics with Prometheus to get a high-level, aggregated view of our system's health.
Today, we complete the triad by focusing on the first and most fundamental pillar: logs. Your goal is to learn how to implement structured, correlated logging (including trace IDs) for effective debugging. This is arguably one of the most critical skills for a senior developer working with microservices, as it directly addresses the immense challenge of debugging in a distributed environment. We will bridge the gap between your logs and your traces, transforming your log files from a simple record of events into a powerful, interactive diagnostic tool.
1. The Challenge: Debugging Across Microservices
In a monolith, all your logs are in one place. When an error occurs, you can typically look at the log file, see the stack trace, and have a good idea of what went wrong.
In a microservices architecture, a single user request might travel through five, ten, or even more services. Each service generates its own logs in its own file or container. If an error occurs in the fifth service, how do you trace the request back to its origin? Trying to piece together the story by manually correlating timestamps across different log files is a nightmare. This is the problem we're here to solve.
2. Structured Logging: Making Logs Machine-Readable
The first step is to stop logging plain text strings and start logging structured data.
Logging Like a Pro in Spring Boot: SLF4J, Logback, Log4j2 EXPLAINED!
To understand the 'why' and 'what' of structured logging and Mapped Diagnostic Context (MDC), watch the first few minutes of this video from the codippa channel.
Watch from 01:53 to 04:39. Focus on: Why plain text logs are difficult for log aggregation tools (like ELK, Loki, Splunk). What structured logging (using JSON) looks like. The concept of Mapped Diagnostic Context (MDC) as a way to enrich log statements with contextual data like a request_id.
As the video explains, structured logs (usually in JSON format) are essential for modern log analysis. Instead of this:
INFO 1234 --- [http-nio-8080-exec-1] c.e.m.s.JobServiceImpl : Fetching job with id: 1
A structured log looks like this:
{
  "timestamp": "2023-10-27T10:00:00.123Z",
  "level": "INFO",
  "thread": "http-nio-8080-exec-1",
  "logger": "com.example.microservice.service.JobServiceImpl",
  "message": "Fetching job with id: 1"
}
This format allows you to easily search, filter, and aggregate logs in a tool like Kibana or Grafana Loki (e.g., "show me all logs with level: ERROR from the JobServiceImpl logger").
To achieve this in Spring Boot, we can use the Logstash Logback Encoder. You just need to add a dependency to your pom.xml:
<dependency>
    <groupId>net.logstash.logback</groupId>
    <artifactId>logstash-logback-encoder</artifactId>
    <version>8.0</version> <!-- Check for the latest version -->
</dependency>
We'll see how to configure this in a moment.
3. Correlated Logging: Connecting the Dots with Trace IDs
Structured logging is good, but it doesn't solve the core problem of connecting logs from different services. For that, we need correlation.
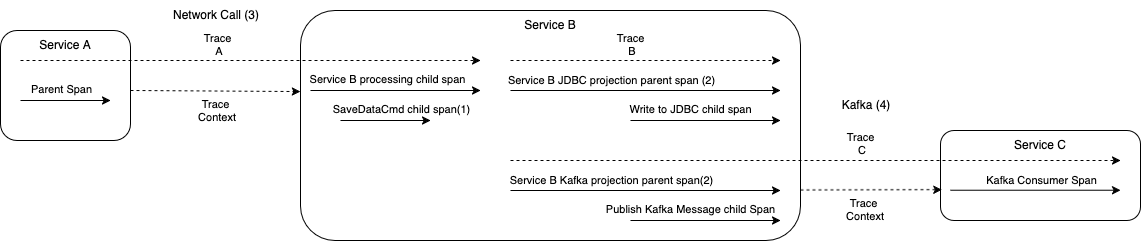
Remember from our lesson on distributed tracing how Micrometer generates a traceId and spanId for every request?
traceId: A unique ID for the entire end-to-end request journey. It stays the same across all services involved.spanId: A unique ID for a specific unit of work (e.g., a single HTTP call, a database query) within a trace.
The key to correlated logging is to include the traceId and spanId in every single log message.
How does it work? MDC + Micrometer Tracing
The magic happens through a combination of the Mapped Diagnostic Context (MDC) and the auto-configuration from Micrometer Tracing.
- MDC: As you saw in the video, MDC is a map-like structure, managed on a per-thread basis. You can put contextual data into the MDC, and your logging framework can then pull this data out and add it to your log lines.
- Micrometer Tracing: When you added the tracing dependencies (
micrometer-tracing-bridge-braveor-otel), Spring Boot auto-configured an interceptor. This interceptor automatically does two things for every request:- It generates or reads the
traceIdandspanId. - It puts them into the MDC with the keys
traceIdandspanId.
- It generates or reads the
This means that for the entire lifecycle of a request thread, the traceId and spanId are automatically available to your logging framework! All you have to do is configure your logger to print them.
4. Implementation: Tying It All Together
Let's configure our application to produce structured, correlated logs. We'll look at two ways to do this.
Method 1: The logback-spring.xml Approach
This method gives you the most control and is essential when you need to send logs to different places (like the console and a log aggregator like Logstash).
End-to-End Guide: Logging & Distributed Tracing with Spring Boot
This article provides a fantastic, practical guide on configuring Spring Boot for logging and tracing. We will follow its steps to configure our dependencies and Logback.
Read 'Step 2: Configure Dependencies', 'Step 3: Logback Configuration', and 'Step 9: Distributed Tracing Across Services'. Pay close attention to: The logstash-logback-encoder dependency. The structure of the logback-spring.xml file. How the pattern uses %X{traceId} and %X{spanId} to pull data from the MDC. The explanation of how Micrometer propagates the traceId between services.
Based on the article, here is a sample src/main/resources/logback-spring.xml:
<?xml version="1.0" encoding="UTF-8"?>
<configuration>
    <include resource="org/springframework/boot/logging/logback/base.xml"/>

    <!-- Appender to log to the console in JSON format -->
    <appender name="CONSOLE_JSON" class="ch.qos.logback.core.ConsoleAppender">
        <encoder class="net.logstash.logback.encoder.LogstashEncoder">
            <!-- This encoder will automatically include MDC properties like traceId -->
        </encoder>
    </appender>

    <!-- Appender for a log aggregator like Logstash/Fluentd -->
    <appender name="LOGSTASH" class="net.logstash.logback.appender.LogstashTcpSocketAppender">
        <destination>localhost:5001</destination> <!-- Example destination -->
        <encoder class="net.logstash.logback.encoder.LogstashEncoder"/>
    </appender>

    <root level="INFO">
        <appender-ref ref="CONSOLE_JSON" />
        <!-- <appender-ref ref="LOGSTASH" /> -->
    </root>
</configuration>
With this configuration and the logstash-logback-encoder on the classpath, a log statement like log.info("User found"); will produce a JSON output similar to this:
{
  "@timestamp": "2023-10-27T10:05:00.543Z",
  "@version": "1",
  "message": "User found",
  "logger_name": "com.example.my.UserService",
  "thread_name": "http-nio-8080-exec-3",
  "level": "INFO",
  "trace_id": "653b8a8f1b2c3d4e5f6a7b8c9d0e1f2a",
  "span_id": "a1b2c3d4e5f6a7b8"
}
Notice the trace_id and span_id fields are automatically included!
Method 2: The Spring Boot Properties Approach (Simpler)
For simpler use cases where you just want to modify the console output format, Spring Boot provides an even easier way. This is a great trick to know for interviews, as it shows deep familiarity with the framework's capabilities.
Spring Boot Reference Documentation: Tracing
The official Spring Boot documentation is the ultimate source of truth. Let's look at how it describes configuring logging correlation.
Read the section titled 'Logging Correlation IDs'. Focus on the logging.pattern.correlation property. This is a powerful, built-in feature.
As the documentation explains, you can add a single property to your application.properties (or .yml) file:
# application.properties

# Defines the pattern to be prepended to log lines for correlation.
# %X{key} pulls from the MDC. The trailing space is important.
logging.pattern.correlation=[%X{traceId:-},%X{spanId:-}]
With this property, your standard console logs will be automatically prepended with the trace and span IDs, like this:
[653b8a8f... ,a1b2c3d4...] INFO 1234 --- [http-nio-8080-exec-1] ... : User found
This method is simpler but less flexible than using a full logback-spring.xml and doesn't produce JSON. For production log aggregation, the LogstashEncoder approach is generally preferred.
Test your understanding!
A teammate says, "I've added the Micrometer Tracing dependency, but my logs don't show the traceId. What am I missing?" What are the two most likely configuration mistakes they've made?
Show answer
They are missing the part that connects the MDC to the log output. The two most likely mistakes are:
- They haven't configured their logging pattern. Micrometer puts the
traceIdinto the MDC, but the logging framework doesn't know it should be printed. They need to either modify theirlogback-spring.xmlto include%X{traceId}in the pattern or set thelogging.pattern.correlationproperty inapplication.properties. - They haven't configured a proper encoder. If they want structured JSON logs, they need to add the
logstash-logback-encoderdependency and configure their appender to use it inlogback-spring.xml. A standardPatternLayoutEncoderwon't produce JSON.
Interview Corner
This topic is a gold mine for senior-level interview questions. Demonstrating a clear understanding of the end-to-end debugging workflow is crucial.
Question: "You are on-call, and an alert fires for a spike in 5xx errors. You don't know which service is failing. All you have is a correlationId provided by the frontend support team from a customer complaint. Describe the exact steps you would take to diagnose the root cause."
A Strong Answer Structure:
- Acknowledge the Tooling: "Assuming we have a standard observability stack with centralized, structured logging (like an ELK stack or Grafana Loki) and distributed tracing (like Zipkin or Jaeger), the process is straightforward."
- Find the Trace: "My first step is to use the
correlationIdto find the associatedtraceId. Our initial service that handles external traffic is configured to log this mapping. I'll search our log management system (e.g., Kibana) for thecorrelationIdto retrieve thetraceIdfor the user's session." - Filter Logs by TraceID: "Once I have the
traceId, the real power of our setup becomes apparent. I'll use thattraceIdas a filter in Kibana/Loki. This will immediately show me all log entries from all microservices that were part of that single, failed request, automatically stitched together in chronological order." - Analyze the Request Flow: "Instead of guessing, I can now read the story of the request. I'll look for the first
ERRORlevel log. Because our logs are structured, I can see not only the error message and stack trace but also the service name, the pod name, and the exactspanIdwhere the failure occurred." - Correlate with Tracing UI: "For a higher-level view, I can also paste the
traceIdinto our tracing UI (Zipkin). The trace view will show me a flame graph, highlighting the failing span in red and showing its duration. This helps me quickly see if the error was caused by a timeout or an immediate exception and which downstream call failed." - Conclusion: "By using the
traceIdto correlate all related logs, I can go from a vague customer complaint to the exact line of code in the specific service that failed in minutes, without ever having to SSH into a server."
Conclusion
Congratulations! You have now connected the final piece of the observability puzzle. By implementing structured, correlated logging, you've unlocked a debugging superpower for microservices. Logs are no longer isolated text files; they are an integral part of a larger, interconnected system that gives you deep visibility into your application's behavior.
Key Takeaways:
- Structured Logging (JSON) is crucial for machine-based analysis and filtering in log aggregation tools.
- Correlated Logging links log entries from a single request across multiple services using a common
traceId. - Micrometer Tracing and MDC work together to automatically make
traceIdandspanIdavailable to your logging framework. - You can implement this using either a detailed
logback-spring.xmlwithLogstashEncoderfor production systems or the simplerlogging.pattern.correlationproperty for quick configuration.
This completes our module on Resilience and Observability. You now have the foundational knowledge to build and operate robust, debuggable microservices.
Preview of the Next Lesson:
With our application now fully instrumented for observability, our next step is to automate how we build, test, and deploy it. In the next module, we'll dive into Containerization & Kubernetes, starting with how to create an optimized, multi-stage Dockerfile for a Spring Boot application.