Hello! Welcome back to our module on Microservices: Resilience & Observability.
In our last lesson, we implemented distributed tracing, the third pillar of observability, using Micrometer Tracing and Zipkin. You learned how to visualize the entire journey of a request as it travels through your microservices, which is crucial for debugging and identifying performance bottlenecks.
Today, we'll tackle the second pillar: metrics. While tracing tells you the story of a single request, metrics give you the aggregated, quantifiable health of your entire system. Your learning outcome is to implement custom application metrics (e.g., counters, timers) using Micrometer and expose them for Prometheus. This skill is fundamental for creating production-grade monitoring and alerting, a key expectation for senior engineering roles.
1. The Metrics Stack: Micrometer & Prometheus
Before writing code, let's understand the tools. In a modern Spring Boot ecosystem, collecting metrics involves a few key components that work together.
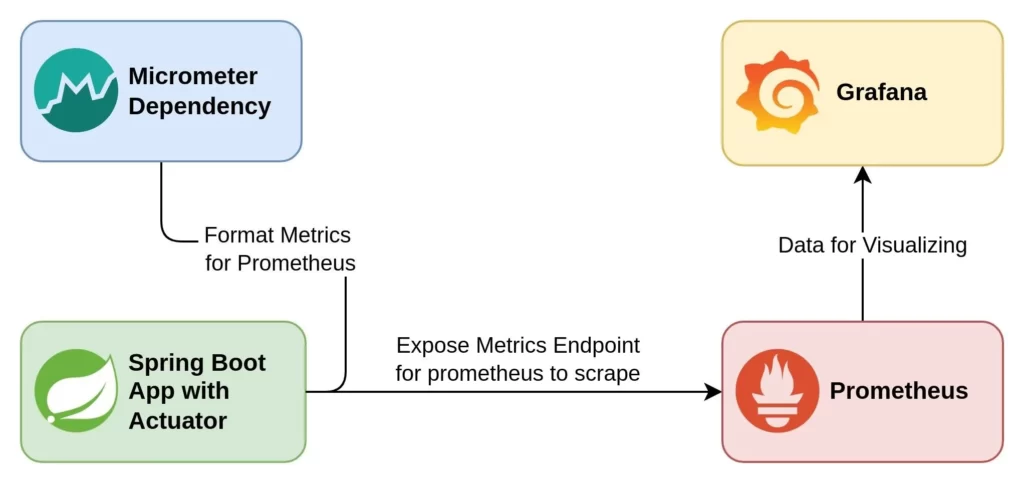
- Micrometer: Think of Micrometer as the SLF4J for metrics. It's a facade or vendor-neutral API that lets you instrument your code without tying it to a specific monitoring system. You write your code against the Micrometer API, and then you can plug in a backend like Prometheus, Datadog, or New Relic by just adding a dependency.
- Prometheus: This is a powerful, open-source monitoring and alerting toolkit. Its core feature is a time-series database. It operates on a pull model, meaning the Prometheus server periodically sends an HTTP request to your application's metrics endpoint to collect the latest data.
2. Setting Up Your Application
Let's get your Spring Boot application ready to produce metrics for Prometheus. This involves adding dependencies and exposing the correct Actuator endpoint.
Tracking Metrics in Spring Boot - Micrometer and Prometheus
The article 'Tracking Metrics in Spring Boot' by Alexander Obregon provides a clear and concise guide to the initial setup. We will use it to add the necessary dependencies and configure the Prometheus endpoint.
Read the sections 'Adding Dependencies for Micrometer and Prometheus' and 'Configuring the Actuator to Expose the Metrics Endpoint'. Pay attention to the two essential dependencies and the management.endpoints.web.exposure.include property.
Based on the article, here are the steps:
-
Add Dependencies to
pom.xml:
You likely already havespring-boot-starter-actuatorfrom the last lesson. The key new dependency ismicrometer-registry-prometheus.<!-- Already present for observability --> <dependency> <groupId>org.springframework.boot</groupId> <artifactId>spring-boot-starter-actuator</artifactId> </dependency> <!-- This dependency tells Micrometer how to format metrics for Prometheus --> <dependency> <groupId>io.micrometer</groupId> <artifactId>micrometer-registry-prometheus</artifactId> </dependency>With these dependencies, Spring Boot auto-configuration will create a
PrometheusMeterRegistrybean for you. -
Expose the Prometheus Endpoint in
application.properties:
By default, Spring Boot doesn't expose all Actuator endpoints over HTTP. You need to explicitly includeprometheus.# Expose health, info, metrics, and the prometheus-specific endpoint management.endpoints.web.exposure.include=health,info,metrics,prometheus
After adding these, restart your application. You can now access http://localhost:8080/actuator/prometheus. You'll see a lot of text output—these are the default JVM, system, and web server metrics that Spring Boot provides out of the box, all formatted for Prometheus to scrape.
3. Implementing Custom Application Metrics
Default metrics are useful, but the real power comes from creating metrics that are specific to your business logic. For example, how many orders have been processed? How long does it take to generate a report?
Micrometer's central interface for this is the MeterRegistry. You simply inject it into any Spring bean and use it to create and update meters. Let's focus on the two most common types: Counter and Timer.
Micrometer with Prometheus for Spring Boot Applications
The article 'Micrometer with Prometheus for Spring Boot Applications' offers excellent code examples and best practices for creating custom meters. We'll use it as a guide for implementing counters and timers.
Read the sections on 'Counter' and 'Timer'. Focus on the builder pattern for creating meters and how the record() method is used for timers. Note the advice that a Timer also includes a count.
Counter
A Counter is a metric that only ever goes up. It's perfect for counting occurrences of an event.
Let's imagine you have a service that processes incoming messages. You want to count how many messages are processed successfully versus how many fail.
@Service
public class MessageProcessingService {

    private final Counter messagesProcessedSuccess;
    private final Counter messagesProcessedFailed;

    public MessageProcessingService(MeterRegistry meterRegistry) {
        // Create a counter for successful messages
        this.messagesProcessedSuccess = Counter.builder("myapp.messages.processed")
                .tag("status", "success")
                .description("The number of successfully processed messages")
                .register(meterRegistry);

        // Create a counter for failed messages
        this.messagesProcessedFailed = Counter.builder("myapp.messages.processed")
                .tag("status", "failure")
                .description("The number of failed messages")
                .register(meterRegistry);
    }

    public void processMessage(Message message) {
        try {
            // Your message processing logic here...
            System.out.println("Processing message: " + message.getId());
            // Simulate some failures
            if (message.getId() % 3 == 0) {
                throw new RuntimeException("Simulated processing error");
            }
            // If successful, increment the success counter
            messagesProcessedSuccess.increment();
        } catch (Exception e) {
            // If an error occurs, increment the failure counter
            messagesProcessedFailed.increment();
        }
    }
}
Key Concepts:
MeterRegistry: Injected via the constructor.- Builder Pattern:
Counter.builder(...)provides a fluent API to define the metric. - Naming Convention: Micrometer uses
lowercase.dot.notation. This will be automatically converted tosnake_casefor Prometheus (e.g.,myapp_messages_processed_total). - Tags (Labels): This is a crucial concept. Instead of creating two metrics (
messages.successandmessages.failed), we create one metric (myapp.messages.processed) and use astatustag to differentiate. This makes querying much more powerful in Prometheus (e.g., you can easily get the total count by summing across all statuses).
Timer
A Timer measures both the frequency and duration of events. It's ideal for tracking the latency of method executions or API calls. A Timer automatically creates a counter for you, so you don't need a separate Counter if you're already timing an event.
Let's time a method that performs a potentially slow operation.
@Service
public class ReportGenerationService {

    private final Timer reportGenerationTimer;

    public ReportGenerationService(MeterRegistry meterRegistry) {
        this.reportGenerationTimer = Timer.builder("myapp.report.generation")
                .description("Time taken to generate a user report")
                .tag("type", "financial")
                .register(meterRegistry);
    }

    public void generateReport() {
        // The record() method takes a lambda and times its execution.
        reportGenerationTimer.record(() -> {
            try {
                // Simulate a slow operation
                Thread.sleep((long) (Math.random() * 1500));
            } catch (InterruptedException e) {
                Thread.currentThread().interrupt();
            }
        });
    }
}
When you use a Timer, Micrometer will generate multiple time series in Prometheus:
myapp_report_generation_seconds_count: The total number of times the event occurred.myapp_report_generation_seconds_sum: The total cumulative time spent on this operation.myapp_report_generation_seconds_max: The maximum time recorded for a single event.- (Optionally) Percentile histograms if configured.
Test your understanding!
You want to measure the response time of a REST controller endpoint. You also want to count how many times this endpoint is hit with a 200 OK status versus a 500 Internal Server Error. Which Micrometer meter(s) should you use and why?
Show answer
You should primarily use a Timer.
- A
Timeris the correct choice for measuring response time, as it's designed to record durations. - A
Timerautomatically includes a count of the events it times, so it already solves the "how many times was it hit" problem. - You can use tags to differentiate between status codes. You would apply a tag like
.tag("status", "200")or.tag("status", "500")to theTimer. This is much more efficient than creating separate timers or counters for each status code.
Note: Spring Boot's web starter does this for you automatically with the http.server.requests metric, but understanding how to do it manually is key.
4. Integrating with Prometheus
Now that your application is instrumented, you need to set up Prometheus to collect the data. This involves running Prometheus (typically in Docker) and giving it a configuration file that tells it where to find your application's metrics endpoint.
Monitoring and Metrics for Spring | with Prometheus - Grafana - Actuator
This video from kanezi gives a great practical demonstration of the entire pipeline, from instrumenting the code to seeing the metrics in Prometheus and Grafana. We will focus on the Prometheus architecture and setup.
Watch the segment from 21:44 to 33:34. The video uses Docker Compose to run Prometheus and Grafana, which is a common setup. Pay attention to: The explanation of Prometheus's pull-based architecture. The structure of the prometheus.yml file, specifically the scrape_configs section where it defines the job_name and targets for your Spring Boot application. The brief tour of the Prometheus UI, showing how to find targets and run a basic query.
The key piece of configuration is the prometheus.yml file. Here’s a minimal example for a local development setup:
# prometheus.yml
global:
  scrape_interval: 15s # How often to scrape targets

scrape_configs:
  - job_name: 'spring-boot-app'
    metrics_path: '/actuator/prometheus' # The path on your app where metrics are exposed
    static_configs:
      - targets: ['host.docker.internal:8080'] # The address of your Spring Boot app
Note: host.docker.internal is a special DNS name that allows a Docker container (like Prometheus) to connect to services running on the host machine. If your Spring app is also running in Docker on the same network, you would use its container name (e.g., 'my-app:8080').
With Prometheus running and configured, it will start scraping your application every 15 seconds, storing the custom metrics you've just created.
Interview Corner
Being able to articulate not just how to implement something, but also the best practices and reasoning behind your choices, is what separates a senior candidate.
Question: "You've joined a team where developers are creating metrics like api_requests_get_users and api_requests_post_orders. What's the problem with this approach, and how would you refactor it using Micrometer and Prometheus best practices?"
A Strong Answer Structure:
- Identify the Problem: "The main problem here is high metric cardinality and poor query flexibility. The developers are embedding dimensional data (the HTTP method and the endpoint path) directly into the metric name. This creates a separate metric for every single combination, which is inefficient and hard to manage."
- Explain the Drawbacks: "This approach makes aggregation difficult. For example, to get the total number of all API requests, you'd have to manually sum up every individual metric. If you want to see all requests for the
/usersendpoint, regardless of method, it's again a complex query. The power of a dimensional time-series database like Prometheus is lost." - Propose the Solution: "The correct approach is to use tags (or labels in Prometheus). I would refactor this to a single metric name, for example
api.requests. Then, I would add tags for the dimensions." - Provide a Code Example: "Using Micrometer, the implementation would look like this:
This singlemeterRegistry.counter("api.requests", "method", "GET", "path", "/api/users") .increment(); meterRegistry.counter("api.requests", "method", "POST", "path", "/api/orders") .increment();api_requests_totalmetric can now be easily queried in Prometheus. For instance,sum(rate(api_requests_total[5m]))gives you the total request rate, andsum(rate(api_requests_total{path="/api/users"}[5m])) by (method)gives you the request rate for the users API, broken down by HTTP method. This is far more flexible and scalable."
Conclusion
Great work! You've now learned how to create and expose custom, business-relevant metrics from your Spring Boot application. This moves you beyond basic application health checks and into the realm of true system observability, where you can quantitatively measure the performance and behavior of your specific services.
Key Takeaways:
- Micrometer is the standard instrumentation facade for JVM applications.
- Prometheus is a pull-based monitoring system that scrapes metrics from an HTTP endpoint.
- Custom metrics are created using the
MeterRegistry. The most common types areCounter(for counting events) andTimer(for measuring duration and frequency). - Tags are essential for creating flexible, queryable metrics. They allow you to add dimensions (like
status,method,region) to your data without creating an explosion of metric names.
Preview of the Next Lesson:
We have now covered metrics and traces. In our next lesson, we will complete our deep dive into the three pillars of observability by focusing on the first: logs. You will learn to implement structured, correlated logging (including trace IDs) for effective debugging. This will tie everything together, showing you how to link your logs directly to the traces you implemented in the previous lesson for a seamless debugging experience.