Hello! Welcome back to our module on Microservices: Resilience & Observability.
In our last lesson, we built a strong theoretical foundation, exploring the three pillars of observability and the core concepts of distributed tracing—Trace IDs, Span IDs, and the modern tracing stack. You learned why tracing is essential for debugging microservices and what components make it work.
Today, we move from theory to practice. Your learning outcome is to implement distributed tracing in a multi-service application using Micrometer Tracing and Zipkin. We will get our hands dirty with code, configure our services to emit trace data, and see the results in a real tracing backend. This is a practical skill that is highly valued in technical interviews for senior roles, as it demonstrates your ability to build and maintain production-ready systems.
1. Understanding the Architecture
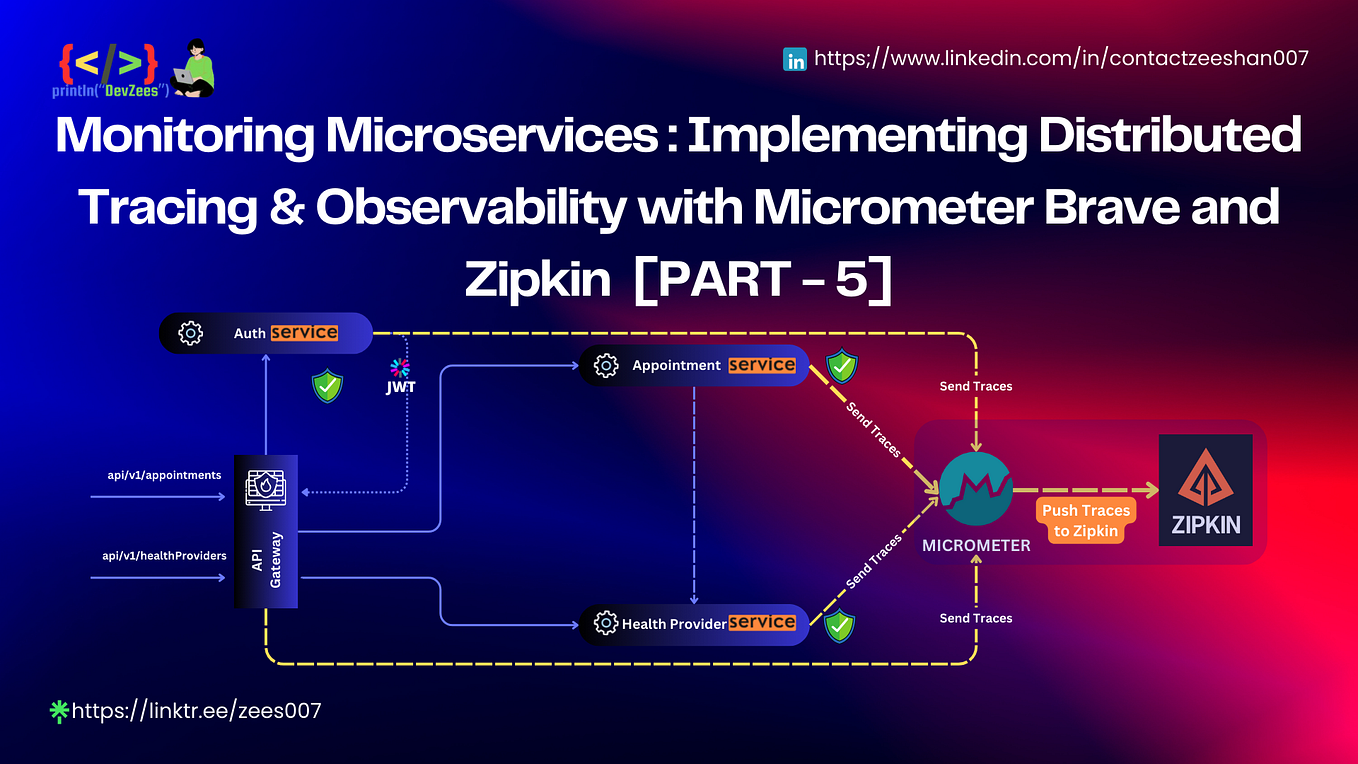
Before we start, let's visualize our goal. We have multiple microservices that communicate with each other to fulfill a request. We want to instrument each service so that it sends trace data to a centralized server, Zipkin, which will then allow us to see the entire request journey.
The core technology we'll use is Micrometer Tracing, the standard tracing facade in Spring Boot 3 and beyond. It replaced the older Spring Cloud Sleuth project. Micrometer provides a vendor-neutral API, and we'll use the Brave implementation, which is the tracer library compatible with Zipkin.
2. Setting Up the Tracing Backend: Zipkin
First, we need a tracing backend to receive and display our traces. We'll use Zipkin, a popular and easy-to-use open-source distributed tracing system. The most common way to run services like Zipkin in a development environment is with Docker.
We will add Zipkin as a service to our project's docker-compose.yml file. This ensures it starts up alongside our other infrastructure, like the database and service discovery server.
Distributed Tracing With Zipkin | Job App API | Spring Boot REST API to Microservices | Video #11
The following video from EmbarkX provides a clear, step-by-step guide on setting up Zipkin. We'll focus on the Docker Compose approach, as it's the most robust method for a multi-container environment.
Watch the segment from 11:11 to 19:03 and then from 27:14 to 30:52. Pay close attention to: The core components of Zipkin: Collector, Storage, Search, and Visualization. The definitions of a Trace (the entire journey) and a Span (a single unit of work). The demonstration of running Zipkin via Docker, first with a docker run command and then by adding it to a docker-compose.yml file. Follow the final Docker Compose setup.
After following the video, your docker-compose.yml should include a new service definition for Zipkin, like the one shown in the video. It will typically expose port 9411.
  zipkin:
    image: openzipkin/zipkin
    container_name: zipkin
    ports:
      - "9411:9411"
Once you run docker-compose up, you should be able to access the Zipkin UI at http://localhost:9411. For now, it will be empty because none of our services are sending data to it. Let's fix that.
3. Instrumenting Your Spring Boot Microservices
Now for the main event: configuring our Spring Boot applications to generate and export traces. This involves two steps: adding dependencies and setting configuration properties.
Step 1: Add the Required Dependencies
As you learned in the official Spring blog post "Observability with Spring Boot 3," Micrometer Tracing requires a few key pieces to work with Zipkin.
Observability with Spring Boot 3
This blog post from the Spring team is the definitive source on the move from Spring Cloud Sleuth to Micrometer Tracing. It clearly outlines the dependencies needed.
Read the 'WebMvc Server Setup' section, focusing on the bullet points under 'Tracing'. This will explain the role of the micrometer-tracing-bridge-brave and zipkin-reporter-brave dependencies.
Based on what you've read and what the video demonstrates, you'll need to add the following dependencies to the pom.xml of each microservice you want to trace:
spring-boot-starter-actuator: This is the foundation for all observability features in Spring Boot, including tracing.micrometer-tracing-bridge-brave: This is the "bridge" library. It connects Micrometer's generic tracing API to Brave, the actual tracing implementation library that Zipkin understands.zipkin-reporter-brave: This is the "reporter." Its job is to take the finished spans from Brave and send them over the network to the Zipkin server.
Here is the XML you'll need to add to your <dependencies> section in each pom.xml:
<!-- For Observability -->
<dependency>
    <groupId>org.springframework.boot</groupId>
    <artifactId>spring-boot-starter-actuator</artifactId>
</dependency>

<!-- For Distributed Tracing with Zipkin -->
<dependency>
    <groupId>io.micrometer</groupId>
    <artifactId>micrometer-tracing-bridge-brave</artifactId>
</dependency>
<dependency>
    <groupId>io.zipkin.reporter2</groupId>
    <artifactId>zipkin-reporter-brave</artifactId>
</dependency>
Step 2: Configure Application Properties
With the dependencies in place, Spring Boot's auto-configuration will handle most of the setup. We just need to provide one crucial piece of configuration in application.properties for each service: the sampling rate.
# Send 100% of traces to Zipkin. Good for development, but not for production.
management.tracing.sampling.probability=1.0

# Optional: Set the application name to identify the service in Zipkin
spring.application.name=your-service-name
The management.tracing.sampling.probability property tells Micrometer what percentage of requests to trace.
- A value of
1.0means 100% of requests will be traced. This is perfect for development and debugging. - A value of
0.1means 10% of requests will be traced. - In a high-traffic production environment, you would use a lower value (e.g.,
0.01for 1%) to reduce the performance overhead and storage costs associated with tracing.
Test your understanding!
You are tasked with instrumenting a high-throughput microservice that handles 10,000 requests per second. Why would setting management.tracing.sampling.probability=1.0 be a bad idea in this scenario?
Show answer
Setting the sampling probability to 1.0 would mean generating, collecting, and sending trace data for every single one of the 10,000 requests per second. This would introduce significant overhead:
- CPU Overhead: The application would spend CPU cycles creating spans and serializing trace data.
- Network Overhead: A large volume of trace data would be sent over the network to the Zipkin collector, potentially saturating the network.
- Storage Overhead: The Zipkin server would need to store a massive amount of trace data, leading to high disk usage and costs.
- Performance Degradation: The query performance in the Zipkin UI would suffer when trying to process such a large volume of data.
In production, you would use a much lower sampling rate to get a representative sample of traces without impacting system performance.
Now, go ahead and apply these dependency and property changes to all the microservices in your project.
4. Visualizing the End-to-End Trace
With everything configured, it's time for the payoff.
Distributed Tracing With Zipkin | Job App API | Spring Boot REST API to Microservices | Video #11
This final video segment will walk you through testing the entire setup. It demonstrates making an API call with Postman and then analyzing the resulting trace in the Zipkin UI. It also shows a crucial troubleshooting step involving the Actuator dependency.
Follow the video from 34:59 to 57:59. The process is: Add all the required dependencies to your services (including actuator!). Add the management.tracing.sampling.probability property. Restart your Docker environment (docker-compose up) and all your Spring Boot applications. Make a request with Postman that triggers a call chain across multiple services. Go to the Zipkin UI (http://localhost:9411), run a query, and explore the traces.
After making a request, head to the Zipkin UI. Click the "Run Query" button. You should now see a list of traces. Find the trace that corresponds to your API call (it will likely be the longest one involving multiple services).

When you click on a trace, you'll see a waterfall diagram. Pay attention to:
- The total duration of the request at the top.
- The individual spans for each service. The length of the bar represents the time taken.
- The service names on the left.
- The dependency graph in the "Dependencies" tab, which shows how your services call each other.
Try stopping one of your downstream services and making the API call again. You'll see the trace show up in red in Zipkin, instantly telling you where the failure occurred.
Interview Corner
Implementing distributed tracing is a common task, and being able to troubleshoot it is a key senior-level skill.
Question: "You've just deployed a new microservice, but its operations are not showing up in your Zipkin traces. What are the most likely causes?"
A Strong Answer Structure:
- "First, I'd check the basics: dependencies and configuration. Did I remember to add
spring-boot-starter-actuator,micrometer-tracing-bridge-brave, andzipkin-reporter-braveto the new service'spom.xml? A missing Actuator is a very common mistake." - "Next, I'd verify the
application.properties. Ismanagement.tracing.sampling.probabilityset to a non-zero value? Forgetting this means no traces will be sent. I'd also check thatspring.application.nameis set, so I can easily identify the service." - "Then, I'd look at networking. Can the new service container resolve and connect to the Zipkin container's address and port (
http://zipkin:9411in a Docker network)? Firewall rules or incorrect network configuration can block the trace data." - "Finally, I'd confirm traffic. Has the new service actually received any requests since it was deployed? Traces are only generated for actual operations. If it's idle, there will be no traces."
Conclusion
Congratulations! You have successfully implemented distributed tracing in a multi-service Spring Boot application. You now have a powerful tool to visualize request flows, pinpoint performance bottlenecks, and diagnose errors in a distributed environment.
Key Takeaways:
- Distributed tracing in Spring Boot 3 is powered by Micrometer Tracing.
- The essential dependencies for Zipkin integration are the actuator, the
micrometer-tracing-bridge-brave, and thezipkin-reporter-brave. - The
management.tracing.sampling.probabilityproperty is critical for controlling trace volume and performance overhead. - The Zipkin UI provides invaluable insights into request latency, service dependencies, and error analysis.
Preview of the Next Lesson:
We've now implemented the third pillar of observability: traces. In the next lesson, we will turn our attention back to the second pillar. You will learn to implement custom application metrics (e.g., counters, timers) using Micrometer and expose them for Prometheus. This will complete your practical knowledge of the core observability pillars.