Hello! Welcome to this lesson in our Microservices: Resilience & Observability module.
In our last lesson, we established a centralized configuration system with Spring Cloud Config, ensuring our services could be managed consistently. However, a complex system of distributed services, even if well-configured, presents a new challenge: when something goes wrong, how do we find out what, where, and why? A single user request might travel through a dozen services, and traditional methods like examining individual log files are no longer sufficient to see the whole picture.
Today, we'll tackle this head-on. Your learning outcome is to explain the three pillars of observability (logs, metrics, traces) and the concept of distributed tracing. This foundational knowledge is non-negotiable for anyone building or maintaining microservices and is a frequent topic in senior engineering interviews.
1. Monitoring vs. Observability: Knowing vs. Asking
Before we dive into the pillars, it's crucial to distinguish between two often-confused terms: monitoring and observability.
- Monitoring is about watching for known problems. You define dashboards and alerts for things you anticipate might go wrong, like high CPU usage or a spike in error rates. It answers questions you already know to ask, such as, "Is the service up?"
- Observability, on the other hand, is about being able to investigate unknown problems. It's the ability to ask arbitrary questions about your system's behavior without having to predict the failure mode in advance. It helps answer questions like, "Why are checkout requests for users in Germany timing out, but only when they use a specific payment method?"
Observability doesn't replace monitoring; it's a broader capability that includes it.
To get a clear understanding of these concepts, let's watch a short video from Pavan Elthepu. It provides excellent examples and a helpful analogy.
Watch the segment from 07:07 to 13:49. Focus on: The definition of observability and its three pillars. The distinction that monitoring alerts you to a problem, while observability helps you find the root cause. The patient monitoring analogy, which is a great way to frame this for interviews.
2. The Three Pillars of Observability
Observability is built on three distinct but complementary types of data, often called the "three pillars." Let's explore each one.
Three Pillars of Observability
The article 'Three Pillars of Observability' from AlgoMaster provides a fantastic written overview of these concepts. It's a great reference to solidify your understanding.
Read the sections 'What is Observability?', 'Why Observability Matters', and the three sections covering each pillar: 'Pillar 1: Logs', 'Pillar 2: Metrics', and 'Pillar 3: Traces'. Pay attention to the 'doctor's toolkit' analogy and the unique purpose of each pillar.
Let's summarize what you've just read.
Pillar 1: Logs
- What they are: Timestamped, immutable records of discrete events. A log entry tells you what happened at a specific point in time within a single service.
- What they answer: "Why did something happen?" They provide the detailed context, including stack traces, error messages, and application state.
- Key Consideration: In a microservices world, unstructured text logs are hard to manage. Structured logs (e.g., JSON) are essential. They allow you to reliably parse, index, and query log data. As recommended in the "Microservices Interview Questions" article, a best practice is to include correlation IDs like
trace_idin every log message, which we'll discuss next.
Pillar 2: Metrics
- What they are: Aggregated, numerical data measured over time (time-series data). Examples include request counts, error rates, and CPU utilization.
- What they answer: "What is happening?" or "Is there a problem?" They give you a high-level view of system health and are perfect for dashboards and alerting.
- Key Consideration: The "Four Golden Signals" (from Google's SRE book) are a great starting point for any service:
- Latency: The time it takes to serve a request.
- Traffic: The demand on your system (e.g., requests per second).
- Errors: The rate of requests that are failing.
- Saturation: How "full" your service is (e.g., memory usage, queue depth).
Pillar 3: Traces
- What they are: A representation of a single request's journey as it propagates through multiple services in your distributed system.
- What they answer: "Where did the problem occur?" Traces excel at pinpointing bottlenecks and understanding service dependencies.
- Key Consideration: This is the pillar that directly addresses the challenge of debugging in a distributed environment. Let's take a deeper look.
Test your understanding!
You see a dashboard alert showing that the p99 latency for your order-service has spiked from 200ms to 3000ms. Which pillar would you use first to investigate, and what would it tell you? What pillars would you use next?
Show answer
-
Metrics (Already Used): The dashboard alert itself comes from metrics. You've used metrics to know that a problem exists (high latency).
-
Traces (Next Step): You would look at slow traces for the
order-serviceduring the time of the spike. A trace would show you the entire call graph for a single slow request, breaking down the time spent in each service it called (e.g.,payment-service,inventory-service,notification-service). This would immediately tell you where the bottleneck is—for example, that thepayment-serviceis taking 2800ms. -
Logs (Final Step): Once the trace has pointed you to the
payment-service, you would then examine the logs for that specific service during that timeframe. You could even filter the logs by thetrace_idfrom the slow trace. The logs would give you the ground-level detail to understand why it was slow, revealing a stack trace, a "connection timed out" error to a third-party payment gateway, or some other specific error message.
3. Deep Dive: The Concept of Distributed Tracing
Distributed tracing pieces together the individual operations of a request into a single, cohesive view. The architecture generally involves a few key components.
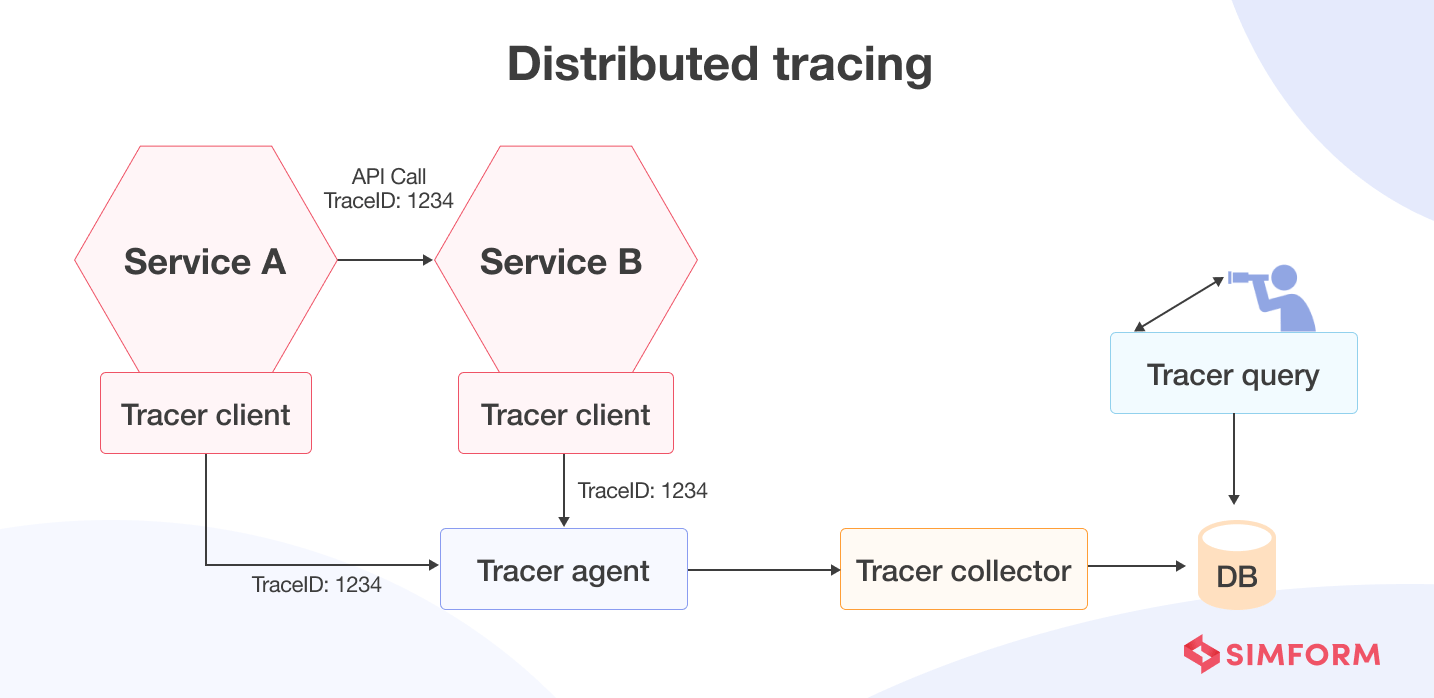
The magic behind this is two key identifiers:
- Trace ID: A unique ID assigned to a request when it first enters your system. This ID is propagated in the headers of every subsequent network call (e.g., REST, gRPC, messaging) made as part of that original request. It's the "thread" that ties everything together.
- Span ID: A unique ID for a single unit of work or operation within a service (e.g., an incoming HTTP request, a database query, an outgoing call to another service). Each trace is composed of one or more spans, which are organized into a parent-child hierarchy.
Distributed Tracing in-depth | Micrometer and Open Telemetry
The video 'Distributed Tracing in-depth' by Shrayansh provides an excellent, detailed explanation of how Trace and Span IDs work and how the modern tracing stack is put together in Spring Boot.
Watch from the beginning to 18:07 and then the section from 20:32 to 31:42. Focus on: The limitations of logs that tracing solves. The roles of Trace ID and Span ID and how they form a hierarchy (06:12 - 18:07). The modern tracing stack: Micrometer (the API), OpenTelemetry (the vendor-agnostic SDK), and a backend like Jaeger or Zipkin (20:32 - 31:42). This is a crucial distinction for senior-level interviews.
As the video explains, the modern ecosystem in the Java world relies on a few key libraries working together:
- Micrometer Tracing: A vendor-neutral tracing facade (API), much like SLF4J is for logging. Your application code interacts with the Micrometer
Tracerinterface. - OpenTelemetry (OTel) Bridge: An implementation of the Micrometer Tracing API. It handles the actual creation and management of traces and spans. This replaces the older, Zipkin-specific library called Brave (used by Spring Cloud Sleuth).
- OTLP Exporter: A library responsible for sending the completed span data (in the OpenTelemetry Protocol format, OTLP) to a backend collector.
- Tracing Backend (e.g., Jaeger, Zipkin, Tempo): A system that receives, stores, and indexes the trace data, providing a UI to visualize and query it.
This de-coupled architecture allows you to change your tracing backend (e.g., switch from Jaeger to Zipkin) with only a configuration change, without touching your application code.
Interview Corner
Understanding observability is a key differentiator in interviews for distributed systems roles.
Question: "How would you design a logging and monitoring strategy for a new microservices-based platform?"
A Strong Answer Structure:
- State the Goal: "My goal would be to achieve full observability, which means not just monitoring for known issues but being able to debug novel problems in production. This relies on the three pillars: metrics, traces, and logs."
- Metrics: "For metrics, I'd use Micrometer to instrument our applications to expose key health indicators, especially the 'Four Golden Signals': latency, traffic, errors, and saturation. These metrics would be scraped by a Prometheus server and visualized in Grafana dashboards, with alerting configured via Alertmanager for critical thresholds."
- Traces: "For traces, I would implement distributed tracing using Micrometer Tracing with the OpenTelemetry bridge. This automatically instruments incoming/outgoing HTTP requests and other components. It would propagate a
trace_idacross service calls, allowing us to see the full journey of a request in a backend like Jaeger or Zipkin. This is critical for identifying performance bottlenecks in our complex call chains." - Logs: "For logs, I would enforce a structured logging policy, outputting logs as JSON. Crucially, I would configure our logging framework (e.g., Logback) to automatically include the
trace_idandspan_idfrom the Micrometer context in every log message. These logs would be shipped by a collector like Fluentd to a centralized logging platform like the ELK Stack (Elasticsearch, Logstash, Kibana) or Loki. This allows us to jump directly from a slow span in a trace to all the relevant, detailed logs for that specific operation, across all services." - Synthesis: "This combination is powerful. An alert on a metric tells us that something is wrong. Distributed tracing tells us where in the system it's wrong. And the correlated, structured logs tell us why it's wrong."
This answer demonstrates a comprehensive, modern approach that any senior engineer at a top company would be expected to know.
Conclusion
Today you've learned the fundamental principles of gaining visibility into complex distributed systems. You can now confidently explain the difference between monitoring and observability, detail the role of each of the three pillars, and describe the core concepts and architecture of distributed tracing.
Key Takeaways:
- Observability is the ability to ask new questions about your system to debug unknown problems.
- The three pillars are Logs (for why), Metrics (for what), and Traces (for where).
- Distributed Tracing stitches together a request's journey using a Trace ID (for the whole request) and Span IDs (for individual operations).
- The modern Java tracing stack uses Micrometer as an API and OpenTelemetry as a standard implementation, sending data to backends like Jaeger or Zipkin.
- The true power comes from correlating the pillars, for example, by including trace IDs in your logs.
Preview of the Next Lesson:
We've covered the "explain" part; next, we'll "implement." In our next lesson, we will get hands-on and implement distributed tracing in a multi-service application using Micrometer Tracing and Zipkin, putting today's theory into practice.