Introduction
In the previous module, we analyzed how markets function by studying supply, demand, and the concept of elasticity. You learned how to measure the responsiveness of both consumers and producers to changes in market conditions. We are now moving into the theory of consumer choice, which provides the microfoundations for the law of demand we've been using. Instead of just observing that demand curves slope downwards, we will build a model from first principles to explain why consumers behave the way they do.
This lesson is the first step in that process. We will introduce the concept of utility, which economists use to represent satisfaction or happiness. Our focus will be on defining and calculating total utility and marginal utility from a consumption schedule. You will learn to verify a key psychological principle in economics: the law of diminishing marginal utility. This foundational concept is crucial for understanding how individuals make consumption decisions.
What is Utility?
Economists use the term utility as a measure of the well-being, happiness, or satisfaction a person gains from consuming a good or service. The overall goal of a rational consumer is assumed to be the maximization of this utility, given their limited income and the prices of goods.
We can think about utility in two ways:
- Total Utility (TU): The total amount of satisfaction obtained from consuming a certain total quantity of a good or service.
- Marginal Utility (MU): The additional satisfaction gained from consuming one more unit of a good or service.
To begin, let's watch a short video that introduces these core concepts.
The video "Utility & Marginal Utility" from the Principles of Microeconomics channel provides a clear introduction to these fundamental ideas.
Please watch the first part of the video, which covers the basic definitions. This segment explains what utility represents and frames the consumer's problem as maximizing utility subject to budget constraints.
An important point from the video is that utility is considered an ordinal concept, not a cardinal one. This means the absolute numbers don't matter as much as their ranking. A utility of 40 is better than a utility of 20, but we cannot say it is "twice as good." For a statistician, this is analogous to the difference between interval/ratio scale data and ordinal scale data; utility is fundamentally about preference ranking.
Calculating Marginal Utility
The core of today's learning outcome is the calculation of marginal utility from a schedule of total utility. The relationship is straightforward: marginal utility is the change in total utility that results from a one-unit change in quantity consumed.
The formula is:
Or, more generally, for any change in quantity:
Let's see this calculation in action.
We'll continue with the same video, "Utility & Marginal Utility."
Watch the next segment, from the pizza example, which demonstrates how to construct a marginal utility column from a total utility schedule. The presenter methodically calculates the MU for each additional slice of pizza and introduces the possibility of negative marginal utility.
The Law of Diminishing Marginal Utility
As you saw in the video, the marginal utility derived from each additional slice of pizza was decreasing. This is a general phenomenon that economists call the law of diminishing marginal utility. It states that as a person consumes more and more of a particular good, the additional utility from each extra unit will eventually decrease. The first slice of pizza when you are hungry is amazing (high MU), but the sixth slice might be far less satisfying (low MU), and could even make you feel worse (negative MU).
It's crucial not to confuse diminishing marginal utility with diminishing total utility. As long as marginal utility is positive, total utility will continue to increase. Total utility only begins to fall when marginal utility becomes negative.
The next video offers another perspective on these calculations and reinforces the concept of diminishing returns to consumption.
In his video "Marginal Utility," Sal Khan from Khan Academy provides further examples using chocolate bars and fruit.
Please watch the segments covering the utility tables and the subsequent explanation of total utility. Notice how he sets up the tables and emphasizes that the marginal utility from each additional unit is declining.
Practice Calculation
Let's apply what you've learned. Consider the data in the table below and calculate the value for Z.

To solve this, you need to find the marginal utility of the 4th unit consumed.
- Total Utility from 3 units (Y) is not given, but we can infer it. The total utility from 2 units is 35, and the marginal utility of the 3rd unit is 10. Therefore, .
- Total Utility from 4 units is 40.
- The marginal utility of the 4th unit (Z) is the change in total utility when moving from 3 to 4 units:
The correct answer is -5. This shows a situation where consuming the fourth unit actually decreases total satisfaction.
The Graphical Relationship between Total and Marginal Utility
The connection between total and marginal utility is most clearly seen graphically. The marginal utility curve is essentially a plot of the slope of the total utility curve.
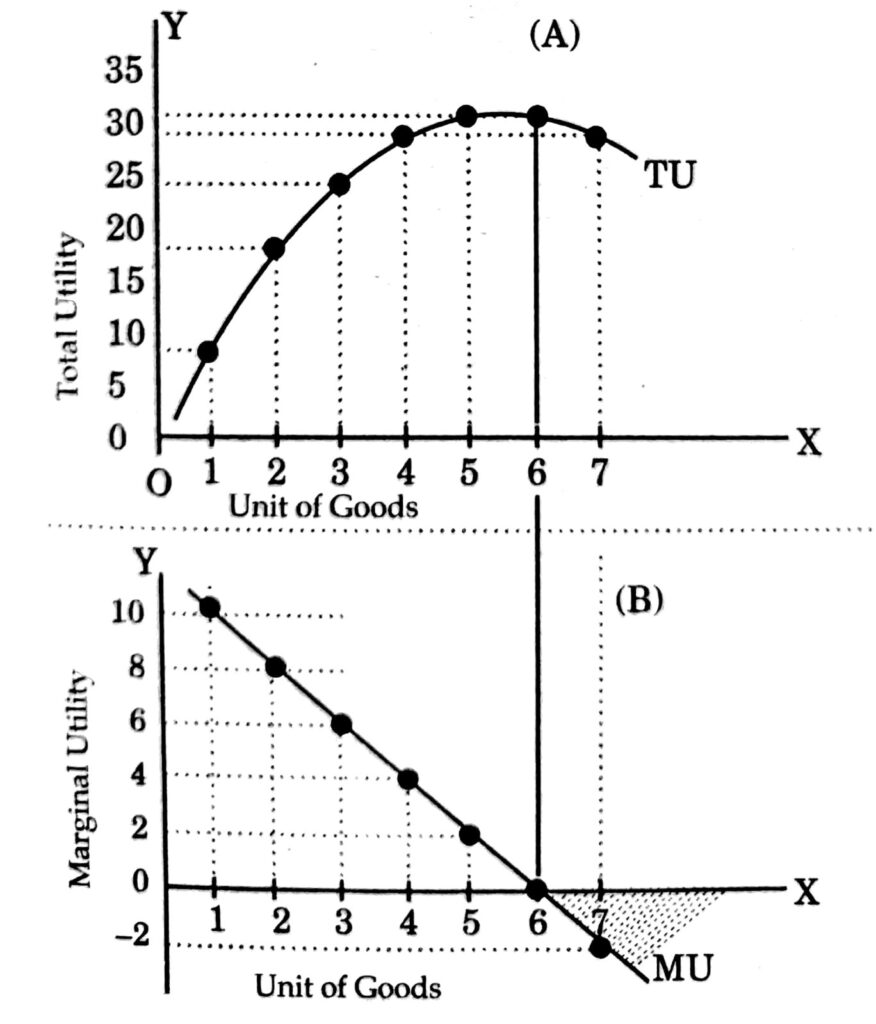
Observe the key relationships shown in these graphs:
- Where TU is increasing, MU is positive. Each additional unit adds to total satisfaction.
- Where the TU curve gets flatter, the MU curve is falling. This is the region of diminishing marginal utility.
- Where TU reaches its maximum, MU is equal to zero. At this point, the consumer is fully satiated; one more unit provides no additional satisfaction.
- Where TU begins to decrease, MU is negative. Consuming more units actually makes the consumer worse off.
A More Rigorous View: Utility and Calculus
Given your background in statistics and quantitative methods, we can formalize this relationship using calculus. For a continuous good, the utility function can be written as , where is the quantity consumed.
Marginal utility is the first derivative of the total utility function with respect to quantity.
This confirms our graphical intuition: marginal utility is the rate of change, or the slope, of the total utility function.
The law of diminishing marginal utility implies that the marginal utility itself decreases as quantity increases. This means the slope of the marginal utility function must be negative. Mathematically, this corresponds to the second derivative of the total utility function being negative.
A negative second derivative means the utility function is concave, which explains the shape of the TU curve in Graph (A) above.
Let's dive into a more formal text that uses this calculus-based approach.
[PDF] Notes on calculus and utility functions - MIT OpenCourseWare
This document from MIT OpenCourseWare provides a concise and rigorous explanation of how calculus is used in utility theory.
First, read the section II. Where is the derivative useful in economics? This part explicitly defines marginal utility as the first derivative of the utility function. Next, focus on the practice problems in section IV, Problem 1. For each of the five utility functions provided (a-e), take the first derivative to find the marginal utility function MU(X). Then, analyze the MU(X) function to determine if it is always positive and if it diminishes as X gets larger (i.e., is its derivative, the second derivative of U(X), negative?). This exercise is a perfect application of your analytical skills to verify the properties of different utility functions.
For instance, let's analyze function (d) from the reading, .
- Marginal Utility: . For any positive quantity , is positive.
- Diminishing MU: To check if MU is diminishing, we can see that as increases, the denominator increases, so the overall fraction decreases. Formally, we take the second derivative of the utility function: . Since is positive, this second derivative is always negative.
Therefore, the utility function exhibits positive and diminishing marginal utility, making it a good candidate for modeling consumer preferences.
Conclusion
In this lesson, you have taken the first step into the theory of consumer behavior. We have moved beyond simply assuming a downward-sloping demand curve to begin understanding the psychological and mathematical principles that drive consumer decisions.
Key Takeaways:
- Total Utility (TU) represents the total satisfaction from consumption, while Marginal Utility (MU) is the additional satisfaction from one more unit.
- Marginal utility can be calculated as the change in total utility for a one-unit change in quantity: .
- The Law of Diminishing Marginal Utility states that as consumption of a good increases, the marginal utility gained from each additional unit will eventually decline.
- Graphically, the MU curve represents the slope of the TU curve. Total utility is maximized when marginal utility is zero.
- Using calculus, marginal utility is the first derivative of the utility function (), and diminishing marginal utility implies a negative second derivative ().
You now understand how to model the satisfaction a consumer gets from goods. However, choice is not just about what you want; it's also about what you can afford. In our next lesson, we will introduce the other side of this puzzle: the budget constraint, which represents the limits on a consumer's spending. By combining utility with the budget constraint, we will soon be able to solve for a consumer's optimal choice.