Introduction
In our last lesson, we established a quantitative framework for understanding opportunity cost as the value of the next-best alternative forgone. We calculated it in specific scenarios by summing explicit and implicit costs. Now, we will elevate this concept from a single decision to the scale of an entire economy.
Today's lesson focuses on the Production Possibility Frontier (PPF), a fundamental graphical model in economics. You will learn how to construct a PPF from a production schedule and, more importantly, how to interpret its shape and slope to measure opportunity cost. This will translate the numerical trade-offs we calculated previously into a powerful visual tool. Given your background in statistics, you'll find the process of plotting data and analyzing the properties of the resulting curve quite natural.
The Production Possibility Frontier: Visualizing Scarcity and Choice
The Production Possibilities Frontier (PPF) shows the maximum possible combinations of two goods that an economy can produce with its available resources and technology, assuming full and efficient use of those resources.
To begin, let's establish the key features of this model.
1.2 Production possibilities frontier and economic growth - Fiveable
This reading from Fiveable provides a concise introduction to the PPF concept and its graphical representation.
Please read the section titled Concept and Graphical Representation. As you read, focus on: The definition of the PPF. The meaning of points on, inside, and outside the curve. The reason for the concave (bowed-outward) shape, which is explained by the law of increasing opportunity cost.
The key insight is that the PPF illustrates the core economic problem of scarcity. An economy cannot have everything; it must make choices. Any point on the curve represents an efficient production choice. A point inside, like an economy during a recession, signifies unemployed resources. A point outside is an ambition, unattainable without more resources or better technology.
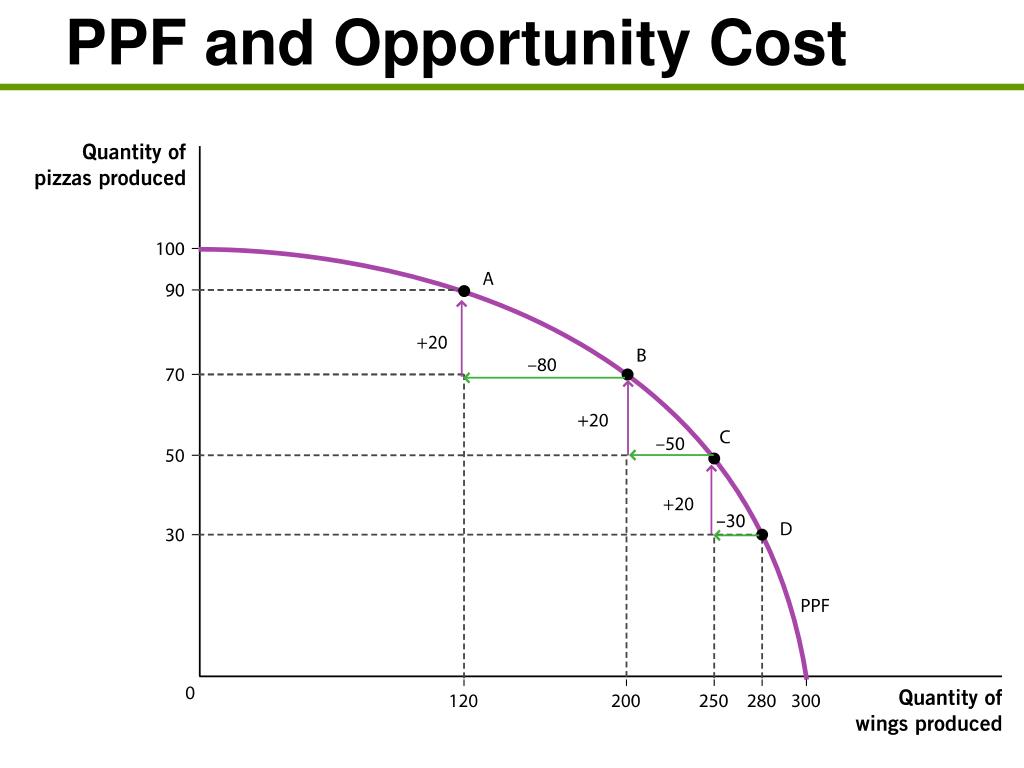
The concave shape is crucial. It reflects that resources are specialized. As an economy shifts production from one good to another (e.g., from pizzas to wings), it first reallocates the resources best suited for the new task. As production continues to shift, it must use resources that are progressively less suitable, meaning the sacrifice—the opportunity cost—of the other good gets larger and larger.
Plotting the PPF and Calculating Opportunity Cost
Now let's move from the abstract concept to a concrete numerical example. We will work through the process of taking a production possibility schedule (a table of data) and turning it into a PPF graph. From there, we can calculate both total and marginal opportunity costs.
The following video provides a comprehensive, step-by-step walkthrough. The presenter's methodical approach will align well with your preference for structured problem-solving.
Numerical Example: Opportunity cost and PPF - Part 1
The video "Numerical Example: Opportunity cost and PPF" by Elias Muwau is an excellent guide to both plotting the PPF and using it for calculations.
Please watch the following segments carefully: Introduction to the Problem: The instructor presents the production data for "guns" and "butter" and outlines the questions, including plotting the PPF and calculating various opportunity costs. Plotting the PPF: Pay close attention to how he first inspects the data to predict a concave shape and then methodically plots each point (A through E) to construct the curve. Calculating Total Opportunity Cost: Here, he calculates the opportunity cost of producing 5 guns and then 9 guns. Notice this is the total amount of butter given up to reach that level of gun production, starting from a point of producing zero guns. Calculating Marginal Opportunity Cost: This is a critical step. The instructor calculates the opportunity cost of producing the ninth gun. This is the cost of moving from the previous point to the new one. He uses the formula: Change in Foregone Good / Change in Gained Good.
Let's formalize the concept of marginal opportunity cost. The slope of the PPF measures the rate at which you can trade one good for another. The absolute value of this slope is called the Marginal Rate of Transformation (MRT).
When moving between two discrete points on the PPF, like from point C to D in the video, the MRT gives you the average opportunity cost over that interval. For a continuous, differentiable PPF, the MRT at a single point is given by the absolute value of the derivative, . The increasing steepness of the concave PPF visually represents an increasing MRT.
Deepening the Understanding of MRT
To solidify your grasp of calculating the MRT, let's watch another short video that focuses squarely on this calculation. This will also reinforce the "loss over gain" formula.
Calculating Marginal Rate of Transformation (MRT) | Production Possibility Curve | Microeconomics
The video "Calculating Marginal Rate of Transformation (MRT)" by ECOHOLICS provides another clear, numerical example.
Please watch the following two clips: Calculating MRT: Follow the step-by-step calculation of MRT for each possibility in the schedule. The presenter explicitly uses the formula \frac{\Delta y}{\Delta x} where Y is the loss and X is the gain. Interpreting the Increasing Trend: The instructor explains what the rising MRT values signify—that producing additional units of bulbs requires sacrificing more and more chairs.
This repeated calculation drives home the connection between the concave shape of the PPF and the principle of increasing opportunity cost.
Your Turn: A Quick Practice Problem
Let's apply what you've learned. Consider the following problem. You don't need to solve it completely, but think through the steps you would take.

Based on the instructions:
- Filling the table: The problem specifies "diminishing returns." As you allocate more resource units to one good (e.g., from 8 to 10 for Agriculture), the additional output gained from each new resource unit should decrease. How would this affect the opportunity cost of producing more agricultural products?
- Drawing the graph: What shape would you expect the PPF to have? Why?
Your reasoning should be that diminishing returns in production for one good means that to produce more of it, you must pull resources away from the other good where they were more productive. This leads directly to increasing opportunity costs and thus a concave PPF.
Conclusion
In this lesson, we have visualized the fundamental economic concepts of scarcity, choice, and trade-offs using the Production Possibility Frontier. You learned not just to plot this frontier from data but to use its slope as a precise measure of opportunity cost.
Key Takeaways:
- The PPF shows the maximum efficient production combinations of two goods.
- Its downward slope illustrates the existence of trade-offs.
- Its concave shape reflects the law of increasing opportunity cost, which arises because resources are not equally productive in all uses.
- The slope's absolute value is the Marginal Rate of Transformation (MRT), which quantifies the opportunity cost of producing one additional unit of a good.
- Total opportunity cost measures the total sacrifice to reach a certain production level, while marginal opportunity cost measures the sacrifice for the next unit.
The PPF elegantly frames the "what to produce" question that every society faces. In our next lesson, we will explore the different systems—market, command, and mixed economies—that societies use to decide where on this frontier they choose to operate.