Introduction
In our previous lessons, we thoroughly explored the IS-LM model, using it to determine the short-run equilibrium levels of income and the interest rate. We also performed policy analysis, calculating how fiscal and monetary actions shift the IS and LM curves to affect this equilibrium. A crucial simplification in that analysis was the assumption of a fixed price level, .
Today, we will relax that assumption, which is a critical step toward building a more complete model of the macroeconomy. This lesson will show you how to derive the Aggregate Demand (AD) curve directly from the IS-LM framework. You will see that the AD curve is not an entirely new concept, but rather a summary of the IS-LM equilibrium for every possible price level. Afterward, we will construct the other side of the market: the Aggregate Supply (AS) curve, explaining why its shape differs in the short run versus the long run. Your analytical skills will be essential as we move from graphical intuition to the algebraic formulation of these fundamental macroeconomic relationships.
Deriving the Aggregate Demand (AD) Curve
The Aggregate Demand curve illustrates the relationship between the overall price level () in an economy and the corresponding quantity of output () for which the goods and money markets are simultaneously in equilibrium. In essence, for every possible price level, there is a unique IS-LM equilibrium, and the AD curve plots these () pairs.
The Graphical Derivation
Let's begin by understanding the logic visually. The key link between the price level and the IS-LM model is the real money supply, . While the IS curve, which represents goods market equilibrium, does not directly depend on , the LM curve most certainly does.
- IS Curve: (unaffected by )
- LM Curve: (shifts when changes)
Consider what happens when the price level increases. For a fixed nominal money supply , a higher reduces the real money supply . This creates an excess demand for real money balances at the initial interest rate and income level. To restore equilibrium in the money market, the interest rate must rise, which corresponds to a leftward (or upward) shift of the LM curve.
The following diagram illustrates this process.
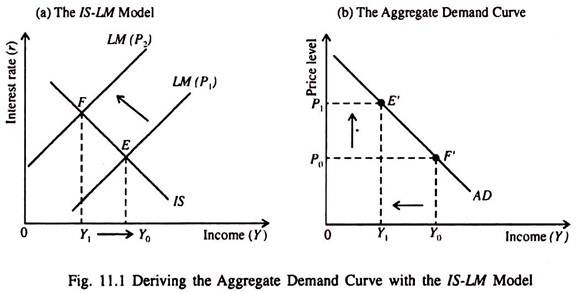
The intuition is straightforward:
- A higher price level reduces the real money supply .
- This shifts the LM curve to the left, raising the equilibrium interest rate .
- The higher interest rate reduces investment spending .
- Lower investment leads to a lower equilibrium output .
The result is a negative relationship between the price level and equilibrium output, which is why the AD curve slopes downward.
The Algebraic Derivation
Given your background, you'll appreciate the formal derivation. We derive the AD curve by solving the IS and LM equations for as a function of , eliminating the interest rate .
The following reading provides a rigorous algebraic derivation of the AD curve's slope and also discusses factors that cause the curve to shift.
[PDF] Lecture 1 IS-LM/ AD-AS Analysis
This document provides a formal derivation of the AD curve from the IS-LM model.
Please read section 5, "The AD (Aggregate Demand) Curve." Begin with the intuitive explanation of why the curve is downward sloping. Then, carefully follow the formal derivation of the slope. The author takes the total derivatives of the IS equation (2.2) and the LM equation (1.4) with respect to P. Pay close attention to how these two equations, (5.1) and (5.2), are combined to solve for dY/dP. The negative sign of this derivative formally proves that the AD curve is downward-sloping. Finally, review the discussion on factors that shift the AD curve. Notice that any variable (other than P) that shifts the IS or LM curves to the right (e.g., an increase in M or G) will also shift the AD curve to the right.
To solidify your understanding, let's work through a numerical example. This is precisely the kind of problem you might encounter on your exam.
[PDF] IS–LM Model - UNC Charlotte Pages
This resource provides a step-by-step numerical example of deriving an AD curve.
Please focus on Problem 3. You have already seen parts of this problem in a previous lesson. First, review parts (a) and (b) to remind yourself of the IS and LM equations: IS: Y = 1,700 – 100r LM: M/P = Y – 100r Now, study part (g) carefully. It shows how to derive the AD equation by solving the IS and LM equations for Y as a function of P. The key step is to first solve both equations for 100r and then set them equal to each other to eliminate the interest rate. Examine the final portion of part (g) to see how an increase in G and an increase in M result in new AD equations, representing shifts of the curve.
Constructing the Aggregate Supply (AS) Curve
The AD curve tells us the equilibrium output for any given price level. However, it doesn't tell us what the price level will actually be. For that, we need to model the supply side of the economy. The Aggregate Supply (AS) curve shows the total quantity of goods and services that firms plan to produce and sell at each price level. It is crucial to distinguish between the long run and the short run.
The Long-Run Aggregate Supply (LRAS) Curve
In macroeconomics, the long run is a period long enough for all prices, including nominal wages, to fully adjust to changes in the economy. In this long-run equilibrium, the economy's output of goods and services is determined by its endowments of capital () and labor (), and the available production technology ().
This level of output is often called the potential output or full-employment output. Because this potential output does not depend on the price level, the Long-Run Aggregate Supply (LRAS) curve is a vertical line at . Any changes in the price level are met with proportional changes in wages and other input costs, leaving the real incentives for production unchanged.
The Short-Run Aggregate Supply (SRAS) Curve
The short run is a period during which some prices are "sticky" or inflexible. The assumption of sticky prices is a cornerstone of Keynesian economics and explains why output can deviate from its potential level. The most common explanation for an upward-sloping SRAS curve is the sticky-wage theory.
The Sticky-Wage Model:
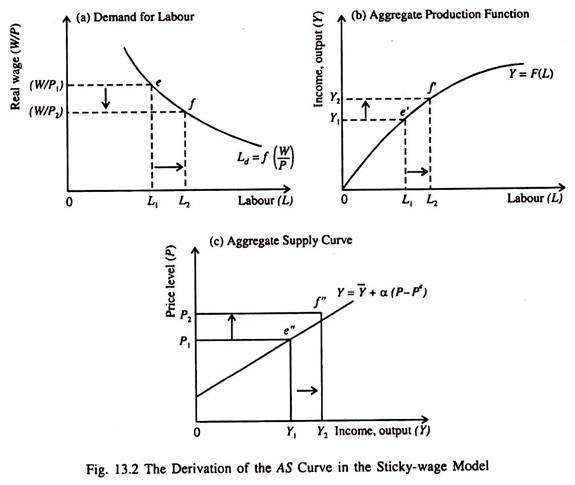
This model assumes that nominal wages () are fixed in the short run, often due to labor contracts or social norms.
- The real wage is .
- If the price level rises, the real wage falls.
- With a lower real wage, labor becomes cheaper for firms.
- Firms hire more labor.
- Increased employment leads to increased output.
This creates a positive relationship between the price level and the quantity of output supplied in the short run. Therefore, the SRAS curve is upward-sloping. The following image neatly illustrates this causal chain.
The reading from the University of Victoria provides more detail on the different models of aggregate supply.
[PDF] Lecture 1 IS-LM/ AD-AS Analysis
This part of the lecture introduces the AS curve, contrasting the long-run and short-run perspectives.
Please read sections 6, 7, and 9. Start with section 6, "The AS (Aggregate Supply) Curve," to understand the distinction between LRAS and SRAS. Note the clear explanation for why the LRAS is vertical. You can skim section 7 ("Perfect Information Walrasian Markets"). This section describes the Classical model, where prices are perfectly flexible. The conclusion is that the SRAS curve is vertical, just like the LRAS. This view implies that money is neutral even in the short run. Focus on section 9, "The Keynesian View and the SRAS Curve." This section is more relevant for the standard model used in your exam. Pay particular attention to subsection (i), "Nominally Rigid Wages, Flexible Prices, And SRAS Curve." This formally explains the sticky-wage mechanism we just discussed.
By bringing AD and AS together, we create a model that can determine both the equilibrium price level and the equilibrium level of output simultaneously.
Conclusion
In this lesson, we bridged the gap between our short-run IS-LM analysis and a more complete macroeconomic model. By allowing the price level to vary, we derived the Aggregate Demand curve and explored the theories behind the shape of the Aggregate Supply curve.
Key Takeaways:
- The Aggregate Demand (AD) curve is derived from the IS-LM model. It is downward-sloping because a higher price level reduces real money balances, which raises the interest rate and reduces investment and equilibrium output.
- The equation for the AD curve can be found algebraically by solving the IS and LM equations for output () as a function of the price level ().
- The Long-Run Aggregate Supply (LRAS) curve is vertical at the economy's potential output (). In the long run, output is determined by real factors of production, not the price level.
- The Short-Run Aggregate Supply (SRAS) curve is upward-sloping, most commonly explained by the sticky-wage theory. When nominal wages are fixed, a higher price level lowers real wages, stimulating hiring and production.
In our next lesson, we will combine these curves into the full AD-AS model. This powerful framework will allow us to analyze how various economic events—such as changes in government policy, shifts in consumer confidence, or supply-side shocks like an oil price increase—affect both output and inflation in the short and long run.