Introduction
In our last session, we explored how the fractional reserve banking system, through the money multiplier, amplifies an initial change in reserves into a much larger change in the total money supply. This naturally leads to a crucial question in macroeconomics: what are the consequences of these changes in the money supply? Today, we delve into one of the oldest and most fundamental theories that addresses this: the Quantity Theory of Money.
This lesson will connect the money supply () to key macroeconomic variables like the price level () and real output (). Your learning outcome is to apply the quantity theory of money (MV = PQ) to calculate the effects of changes in money supply on the price level. The theory is elegantly expressed through a simple equation, and given your background in statistics, you'll find its transformation into a dynamic relationship between growth rates to be both intuitive and powerful for analysis.
The Equation of Exchange
At the heart of the quantity theory is a relationship called the equation of exchange. In its most basic form, it's an identity—a statement that is true by definition. It links the amount of money in an economy to the total value of transactions.
The equation is:
Let's break down each component. The image below provides a quick reference, although it uses for transactions, which we will soon replace with for output.
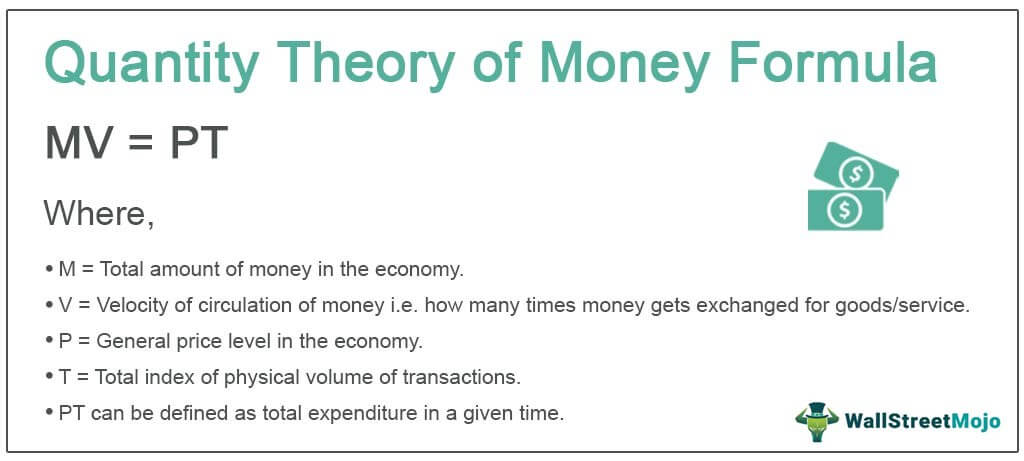
- M (Money Supply): The total amount of money in circulation.
- V (Velocity of Money): The average number of times a unit of money (e.g., a dollar) is spent on final goods and services in a given period. It measures how quickly money circulates through the economy.
- P (Price Level): The average price of all final goods and services produced in the economy (e.g., the GDP deflator).
- Y (Real GDP): The total quantity of all final goods and services produced.
The right side of the equation, , gives us the Nominal GDP, which is the total dollar value of everything produced. The left side, , represents the total amount of spending in the economy. By definition, total spending must equal the value of what was purchased.
To see how these components are formally defined and linked, the following video provides a concise explanation. It also clarifies why economists often use Real GDP () as a practical proxy for the total volume of transactions (), which is much harder to measure.
Quantity theory of money - Mankiw Ch. 5 part 1
This video, "Quantity theory of money - Mankiw Ch. 5 part 1" from the Easy Econ channel, introduces the concept of velocity and derives the quantity equation.
Please watch the first part of the video, from the introduction of velocity. Focus on the logic of how velocity is defined and how the equation of exchange, M \times V = P \times Y, is constructed as an accounting identity.
From an Identity to a Theory
The equation of exchange itself doesn't make any predictions; it's always true. To turn it into a testable theory—the Quantity Theory of Money—we must introduce a few key assumptions about how these variables behave, particularly in the long run.
-
Velocity (V) is stable: The theory assumes that the velocity of money is relatively constant over time. The institutional factors that determine velocity, such as how often people are paid, the efficiency of payment systems (like credit cards and electronic transfers), and general spending habits, do not change quickly. If we assume is constant, we can denote it as .
-
Output (Y) is determined by real factors: In the long run, an economy's ability to produce goods and services () is determined by its factors of production (labor, capital, natural resources) and its level of technology. This is the classical dichotomy, which posits that real variables (like output and employment) are not affected by monetary variables (like the money supply) in the long run. This concept is also known as monetary neutrality. We can therefore treat as fixed at its potential level, .
With these two assumptions, our equation becomes:
Rearranging to solve for the price level , we get:
Since and are assumed to be constant, this equation shows a direct, proportional relationship between the money supply () and the price level (). If the central bank doubles the money supply, the price level will also double. This is the central prediction of the quantity theory: in the long run, changes in the money supply cause proportional changes in the price level.
The following diagram illustrates this relationship from the perspective of the money market. An increase in the money supply (a rightward shift of the vertical money supply curve) reduces the value of money (1/P), which is equivalent to increasing the overall price level (P).

The next segment of the video explains precisely how these assumptions transform the equation into a predictive theory of the price level.
Quantity theory of money - Mankiw Ch. 5 part 1
Continuing with the "Easy Econ" video.
Please watch the segment from the discussion of assumptions. This part is crucial as it explains the causal link from the money supply (M) to the price level (P) that defines the Quantity Theory.
Inflation and Money Growth: The Dynamic Form
For practical analysis, it's often more useful to look at the growth rates of the variables. The quantity equation can be expressed in terms of percentage changes, which, for small changes, is a very good approximation:
Where is the growth rate of the money supply, is the growth rate of the price level (i.e., the inflation rate, ), and so on.
Now, let's re-apply our key assumption from the quantity theory: velocity is constant (). The equation simplifies to:
Rearranging to solve for the inflation rate, we get the theory's most powerful result:
This equation provides a clear prediction: the inflation rate is the difference between the growth rate of the money supply and the growth rate of real GDP. If the central bank is printing money faster than the economy is producing new goods and services, the excess money growth will translate directly into inflation. For instance, if the money supply grows by 7% and real GDP grows by 3%, the inflation rate will be approximately 4%.
A key implication is the one-for-one relationship between money growth and inflation. If the growth rate of real GDP is held constant, a 1 percentage point increase in the rate of money growth will cause a 1 percentage point increase in the inflation rate.
This next video segment will walk you through this transformation into growth rates and explain its implications.
Quantity theory of money - Mankiw Ch. 5 part 1
Again, from the "Easy Econ" video.
Watch the portion from the conversion to growth rates. Pay close attention to how the final inflation equation is derived and interpreted.
Applying the Theory: Calculations
Now, let's put the theory to work by solving a typical exam-style problem. This is where your quantitative skills come into play.
First, let's watch a worked example that uses the inflation equation we just derived, and also connects it back to the Fisher equation (nominal interest rate = real interest rate + inflation), which you've seen in a previous module.
Quantity theory of money - Mankiw Ch. 5 part 1
The final recommended segment from the "Easy Econ" video.
Watch the numerical example presented from the problem-solving section. Follow the steps to calculate inflation and then the nominal interest rate.
Now, try a similar problem yourself. The following reading contains a "Problems and Applications" section from a standard textbook's solutions manual.
Mankiw SM 8e Chap05:chap04.qxd.qxd
This document contains worked-out problems. We will focus on the first one, which is a direct application of the quantity theory in its percentage-change form.
Please read Problem 1. The problem states: the nominal interest rate is 11%, the money supply is growing at 14% per year, real GDP is growing at 5% per year, and velocity is constant. Your task is to find the real interest rate. First, use the quantity theory equation in percentage-change form to calculate the inflation rate. Then, use the Fisher equation to find the real interest rate. The text provides the full solution for you to check your work.
Your calculation should have been:
- Inflation Rate ():
- Real Interest Rate (r):
This type of calculation is a core application of the theory and is very common in economics exams.
Conclusion
In this lesson, we bridged the gap between changes in the money supply and their long-run effects on the economy. We saw how the simple accounting identity of the equation of exchange transforms into the powerful Quantity Theory of Money with a few key assumptions.
Key Takeaways:
- The equation of exchange, , is an identity stating that total spending equals the nominal value of output.
- The Quantity Theory of Money assumes stable velocity () and monetary neutrality (real GDP, , is unaffected by in the long run).
- The theory's main prediction is that changes in the money supply lead to proportional changes in the price level.
- In its dynamic form, the theory gives us the inflation equation: . Inflation is determined by money supply growth in excess of real output growth.
You are now able to analyze and calculate the long-run impact of money supply changes on inflation. This provides the fundamental reason why central banks are so focused on managing the growth of money. In our next lesson, we will turn our attention to the specific monetary policy tools that central banks use to exert this control, such as open market operations and changes to the reserve requirement.