Hello! Welcome to the third module of our course, "Classical ML: Feature Engineering for Code."
Introduction
In the previous module, we focused on data collection. You learned how to mine software repositories to extract raw data: commit histories from Git, complexity metrics from Abstract Syntax Trees (ASTs), flakiness indicators from test logs, and dependency maps from code and configuration files. You now have a powerful toolkit for gathering the basic ingredients for our ML models.
However, raw data like commit messages or lists of changed files isn't directly usable by most machine learning algorithms. We need to transform it into a structured, numerical format. This process is called feature engineering, and it's the bridge between data collection and model training.
In this lesson, we'll take our first step into feature engineering. Our goal is to engineer features from git history, such as change frequency, author count, and recency of changes. These features, often called process metrics, capture the dynamics of how a codebase evolves and are powerful predictors of software quality issues.
From Raw History to a Structured Dataset
Remember how we used libraries to traverse a Git repository's history in the last module? Now, we'll process that stream of information to create a structured dataset. Your experience with Pandas will be very useful here, as our goal is to transform the chaotic log of commits into a clean DataFrame.
The PyDriller library, which we've touched upon, is our main tool for this. It excels at not just extracting raw information but also at calculating higher-level metrics. Let's start by seeing how to get the basic commit data into a familiar format.
The following blog post provides a clear, practical walkthrough of this process. It demonstrates how to iterate through commits and load their attributes into a Pandas DataFrame.
Extracting git repository data with PyDriller - Accessible AI
Let's review the fundamental process of extracting commit data. This article, 'Extracting git repository data with PyDriller' from Accessible AI, shows how to loop through a repository and collect commit-level information.
Please read the sections 'Connecting to the Repository' and 'Validating the Load Process'. Focus on the main code block that loops through repo.traverse_commits(). Observe how attributes like commit.hash, commit.author.name, and commit.insertions are extracted and stored. Notice how the final list is converted into a Pandas DataFrame, a workflow you're likely familiar with.
After running code like that in the article, you'd end up with a structured table of data, where each row represents a commit.
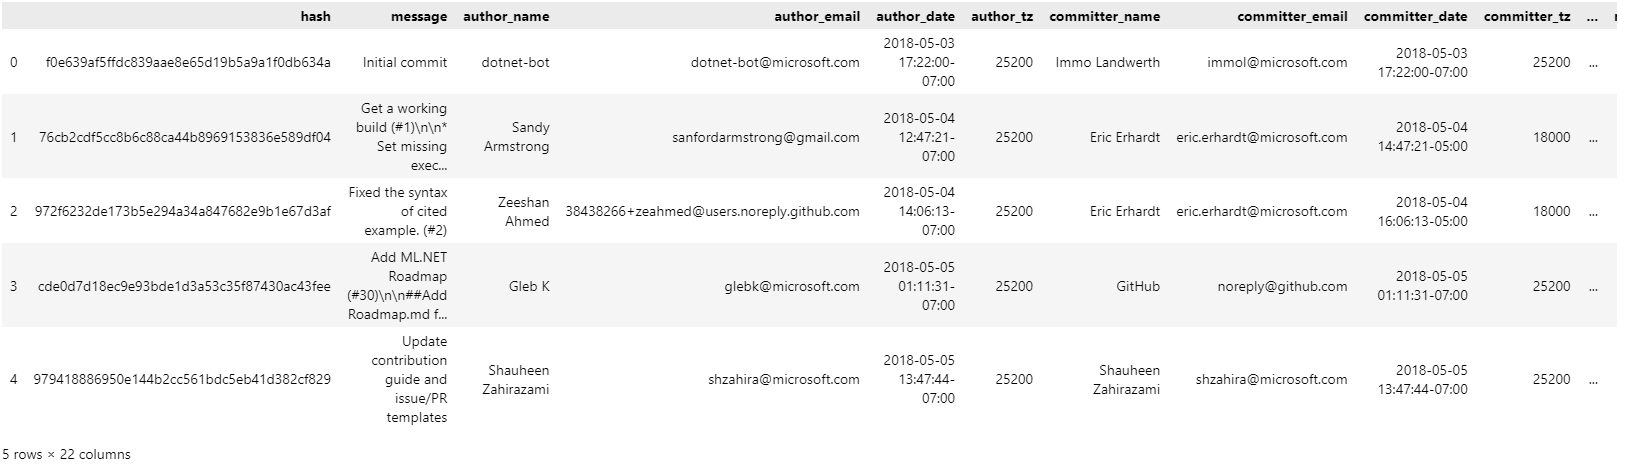
This commit-level view is useful, but for many quality prediction tasks (like identifying risky files), we need to aggregate this information at the file level. That's what we'll do next.
Engineering File-Level Process Metrics
We will now calculate three key features for each file in a repository: change frequency, author count, and recency of changes. These metrics can help a model learn patterns like "files that are changed often by many different people are more likely to be flaky."
PyDriller provides a convenient metrics API that handles many of these calculations for us.
Let's dive into the official PyDriller documentation to see how to use this API.
PyDriller Documentation - Process Metrics
The PyDriller documentation provides a direct way to calculate several process metrics. We'll use this as our main reference for the following sections.
Please read Chapter 7, 'Process Metrics'. Skim through the introduction and then focus specifically on the subsections for 'Commits Count' (Section 7.3), 'Contributors Count' (Section 7.4), and 'Code Churn' (Section 7.2). Pay attention to the simple class-based interface for each metric.
As you saw in the documentation, PyDriller makes calculating these metrics very straightforward. Let's look at each one in detail.
1. Change Frequency (Commit Count)
What it is: The number of times a file has been modified within a given history.
Why it matters: A file with a high change frequency is a "hotspot." It might be a core part of the system that is constantly being adapted, or it could be a source of persistent bugs that require frequent fixes.
You can calculate this using pydriller.metrics.process.commits_count.CommitsCount.
from pydriller import Repository
from pydriller.metrics.process.commits_count import CommitsCount


# Let's analyze a specific repository, e.g., PyDriller itself.
# In a real project, you'd clone this locally first.
repo_url = 'https://github.com/ishepard/pydriller.git'


# We can specify a date range for the analysis
# from datetime import datetime
# since_date = datetime(2022, 1, 1)
# to_date = datetime(2022, 12, 31)


# metric = CommitsCount(path_to_repo=repo_url, since=since_date, to=to_date)


# Or analyze the entire history
metric = CommitsCount(path_to_repo=repo_url)
commit_counts = metric.count()


# The result is a dictionary: {filepath: commit_count}
print("--- Change Frequency (Top 5) ---")


# Sort by count and print top 5
sorted_counts = sorted(commit_counts.items(), key=lambda item: item[1], reverse=True)
for filepath, count in sorted_counts[:5]:
    print(f"{filepath}: {count} commits")
2. Author Count (Contributors Count)
What it is: The number of unique developers who have modified a file.
Why it matters: A high number of contributors might indicate a lack of code ownership, which can lead to inconsistent design and diffused responsibility. This is a classic indicator used in technical debt models.
This is calculated with pydriller.metrics.process.contributors_count.ContributorsCount.
from pydriller.metrics.process.contributors_count import ContributorsCount

metric = ContributorsCount(path_to_repo=repo_url)
author_counts = metric.count()

print("\n--- Author Count (Top 5) ---")
sorted_authors = sorted(author_counts.items(), key=lambda item: item[1], reverse=True)
for filepath, count in sorted_authors[:5]:
    print(f"{filepath}: {count} authors")
3. Recency of Changes
What it is: How recently a file has been modified. This is often measured as the number of days since the last change.
Why it matters: Code that has been changed recently is more likely to contain undiscovered bugs compared to stable, older code. This principle is the foundation of many "just-in-time" defect prediction models.
PyDriller's metrics API doesn't have a direct "recency" metric, but it's easy to calculate ourselves by traversing the commits. This is a great example of combining pre-built tools with your own data processing logic.
import pandas as pd
from datetime import datetime, timezone


# We'll collect commit data and process it with Pandas
commit_data = []
repo = Repository(repo_url, order='reverse') # Newest commits first
latest_commit_date = next(repo.traverse_commits()).committer_date

for commit in repo.traverse_commits():
    for mod in commit.modifications:


        # Use new_path, fallback to old_path for deletions
        filepath = mod.new_path or mod.old_path
        if filepath:
            commit_data.append({
                'filepath': filepath,
                'last_modified_date': commit.committer_date
            })


# Convert to DataFrame
df = pd.DataFrame(commit_data)


# Find the most recent modification date for each file
recency_df = df.groupby('filepath')['last_modified_date'].max().reset_index()


# Calculate days since last change
recency_df['days_since_last_change'] = (latest_commit_date - recency_df['last_modified_date']).dt.days


# Sort to see the most recently changed files
recency_df_sorted = recency_df.sort_values('days_since_last_change').head(5)

print("\n--- Recency of Changes (Top 5 Most Recent) ---")
print(recency_df_sorted)
Putting It All Together
Now, let's combine these concepts into a single script that generates a feature matrix. Our final output will be a Pandas DataFrame where each row represents a file and each column represents one of our engineered features. This is exactly the kind of input a machine learning model expects.
import pandas as pd
from pydriller import Repository
from pydriller.metrics.process.commits_count import CommitsCount
from pydriller.metrics.process.contributors_count import ContributorsCount

repo_url = 'https://github.com/ishepard/pydriller.git'


# --- 1. Calculate Commit and Contributor Counts ---
commits_metric = CommitsCount(path_to_repo=repo_url)
commit_counts = commits_metric.count()

contributors_metric = ContributorsCount(path_to_repo=repo_url)
author_counts = contributors_metric.count()


# Convert to Pandas Series for easy joining
s_commits = pd.Series(commit_counts, name='change_frequency')
s_authors = pd.Series(author_counts, name='author_count')


# --- 2. Calculate Recency ---
commit_data = []
repo = Repository(repo_url, order='reverse')
latest_commit_date = next(repo.traverse_commits()).committer_date

for commit in repo.traverse_commits():
    for mod in commit.modifications:
        filepath = mod.new_path or mod.old_path
        if filepath:
            commit_data.append({'filepath': filepath, 'date': commit.committer_date})

df_recency = pd.DataFrame(commit_data)
s_recency = df_recency.groupby('filepath')['date'].max()
s_recency = (latest_commit_date - s_recency).dt.days
s_recency.name = 'days_since_last_change'


# --- 3. Combine into a single DataFrame ---
feature_df = pd.concat([s_commits, s_authors, s_recency], axis=1)
feature_df.index.name = 'filepath'
feature_df = feature_df.fillna(0) # Handle files that might be missed by one metric

print("\n--- Final Feature Matrix ---")
print(feature_df.sort_values('change_frequency', ascending=False).head(10))
This final DataFrame is a powerful asset. You could, for instance, join this data with information about which files were involved in build failures. You could then train a classification model to predict, based on these process metrics, whether a newly changed file is likely to cause a failure in the future.
Conclusion
In this lesson, we made the critical transition from raw data collection to structured feature engineering. You learned how to transform a repository's Git history into valuable numerical features that describe the development process.
Our key takeaways are:
- Process Metrics are features derived from the software development process, such as changes, authors, and timing.
- We can compute change frequency (
CommitsCount) to identify code hotspots. - We can measure author count (
ContributorsCount) to assess code ownership. - We can calculate the recency of changes to pinpoint recently modified, and therefore potentially riskier, code.
- The
PyDrillerlibrary provides high-level APIs for some metrics, and we can use its basicRepositorytraversal to calculate custom ones.
Preview of the Next Lesson:
Git history is just one source of information. Another incredibly rich source is the log of past test runs. In our next lesson, we will continue our journey into feature engineering by learning how to compute aggregate flakiness features from historical test execution patterns. We'll transform raw pass/fail logs into features like "historical failure rate" and "rerun success ratio" to help us build models that can directly predict test flakiness.