Welcome to the final lesson in our module on advanced statistical modeling. In our previous sessions, you've learned how to fit, interpret, and visualize predictions from linear mixed-effects models using lme4. Visualizations are powerful, but for formal reporting in research papers and theses, you also need to present the model's numerical results in clear, well-formatted tables.
Today, we will address a common bottleneck in the data analysis workflow: getting statistical results out of R's model objects and into a usable format. You will learn how to use the broom.mixed package to convert the complex output of an lmer model into a "tidy" data frame. This skill is the bridge between running a sophisticated model and reporting it professionally, a crucial step toward your goal of producing publication-quality analyses.
The Problem: Model Objects are Messy
After you fit a model in R, for instance with lmer(), you get a model object. You've used summary() to print a useful overview of this object to the console. While this summary is great for a quick look, it's surprisingly difficult to work with programmatically. If you wanted to extract the p-value for a specific coefficient to put in a table, or plot the confidence intervals for all coefficients, you would need to write cumbersome and fragile code to parse the text output or navigate a deeply nested list structure.
This is a common frustration in R. Model objects are often complex and don't follow the "tidy data" principles that make packages like dplyr and ggplot2 so powerful.
Broom: Converting Statistical Models to Tidy Data Frames
This short talk by David Robinson, the creator of the broom package, provides the perfect introduction to the problem we're trying to solve.
Please watch the segment from this video, where the speaker explains why standard model objects in R are "messy" and highlights the specific challenges in trying to extract information from them.
As you saw, getting information out of a standard model summary involves multiple steps, dealing with information hidden in row names, and manually calculating values that are printed but not stored. This is inefficient and error-prone, especially when you need to report results from multiple models.
The Tidy Solution: The broom Package
The broom package was created to solve this exact problem. It provides a set of functions that convert the messy output of various statistical models into tidy data frames. A "tidy" data frame has a consistent structure: one observation per row, one variable per column.
The broom philosophy revolves around three main verbs, each for a different level of model summary:
tidy(): This function summarizes the components of the model. For a regression model, this typically means one row for each coefficient (or term) in the model, with columns for the estimate, standard error, p-value, etc.augment(): This adds observation-level information to the original data used to fit the model. For example, it can add columns for fitted values (predictions) and residuals for each data point. You have already seen this in action, as packages likeggeffectsuse this principle to generate prediction data frames.glance(): This provides a single-row summary of the entire model, containing statistics like R-squared, AIC, BIC, and the log-likelihood.
Broom: Converting Statistical Models to Tidy Data Frames
Now, let's look at how broom provides the solution.
Continue watching the same video from the introduction to the three broom verbs. Pay close attention to the distinct purpose of tidy(), augment(), and glance().
Tidying Mixed-Models with broom.mixed
The lmer models you've been working with are more complex than standard linear models. They have both fixed effects (the population-level coefficients like time_point) and random effects (the variance components, like the variance between subjects).
Because of this added complexity, the original broom package has been extended by broom.mixed, a package specifically designed to handle the output of mixed-effects models from lme4 and other similar packages.
Let's see it in action. First, make sure you have the package installed and loaded, along with lme4.
# install.packages("broom.mixed")
library(lme4)
library(broom.mixed)
Now, let's refit the sleepstudy model we've used before.
data(sleepstudy, package = "lme4")
fit <- lmer(Reaction ~ Days + (Days | Subject), data = sleepstudy)
First, let's look at the standard summary() output, which you've seen before. It's informative but not "tidy."
summary(fit)
## Linear mixed model fit by REML ['lmerMod']
## Formula: Reaction ~ Days + (Days | Subject)
##    Data: sleepstudy
##
## REML criterion at convergence: 1743.6
##
## Scaled residuals:
##     Min      1Q  Median      3Q     Max
## -3.9536 -0.4634  0.0231  0.4634  5.1793
##
## Random effects:
##  Groups   Name        Variance Std.Dev. Corr
##  Subject  (Intercept) 612.10   24.741
##           Days         35.07    5.922   0.07
##  Residual             654.94   25.592
## Number of obs: 180, groups:  Subject, 18
##
## Fixed effects:
##             Estimate Std. Error t value
## (Intercept)  251.405      6.825  36.838
## Days          10.467      1.546   6.771
##
## Correlation of Fixed Effects:
##      (Intr)
## Days -0.138
Now, let's apply broom.mixed::tidy() to the same fit object.
tidy(fit)
## # A tibble: 5 × 7
##   effect   group    term            estimate std.error statistic
##   <chr>    <chr>    <chr>              <dbl>     <dbl>     <dbl>
## 1 fixed    NA       (Intercept)       251.       6.82      36.8
## 2 fixed    NA       Days               10.5      1.55       6.77
## 3 ran_pars Subject  sd__(Intercept)    24.7     NA         NA
## 4 ran_pars Subject  cor__(Intercept)    0.0678  NA         NA
## 5 ran_pars Residual sd__Observation    25.6     NA         NA
Look at that beautiful, clean data frame! This is a format you can immediately use with dplyr to filter, ggplot2 to plot, or feed into a table-making function.
Let's break down the columns:
effect: Crucially, this tells you if the row refers to afixedeffect or a random-effect parameter (ran_pars).group: For random effects, this specifies the grouping factor (e.g.,Subject).term: The name of the parameter. For fixed effects, these are your predictors. For random effects, they are standard deviations (sd__...) or correlations (cor__...).estimate: The calculated value for that term.std.errorandstatistic: The standard error and t-statistic for the fixed effects. These areNAfor the default variance components because their statistical inference is more complex.
You can also ask tidy() to compute confidence intervals, which is very useful for reporting.
tidy(fit, conf.int = TRUE)
## # A tibble: 5 × 9
##   effect   group    term            estimate std.error statistic conf.low conf.high
##   <chr>    <chr>    <chr>              <dbl>     <dbl>     <dbl>    <dbl>     <dbl>
## 1 fixed    NA       (Intercept)       251.       6.82      36.8    238.      265.
## 2 fixed    NA       Days               10.5      1.55       6.77     7.42      13.5
## 3 ran_pars Subject  sd__(Intercept)    24.7     NA         NA       14.4       37.7
## 4 ran_pars Subject  cor__(Intercept)    0.0678  NA         NA       -0.491      0.622
## 5 ran_pars Residual sd__Observation    25.6     NA         NA       22.9       28.9
This adds conf.low and conf.high columns, giving you the 95% confidence intervals for every parameter in your model, ready for reporting.
Application: Creating Publication-Quality Tables
The primary use of broom.mixed::tidy() is as a backend for other packages that create beautiful summary tables. Packages like modelsummary, gtsummary, and sjPlot are designed to take a model object and produce a publication-ready table. Under the hood, they use broom.mixed to extract the necessary information in a tidy format before arranging it into a table.
R/R Markdown Table Options for Multilevel Models | Anthony Schmidt
This blog post by Anthony Schmidt is a practical survey of different packages for creating model summary tables. It perfectly illustrates why broom.mixed is an essential part of the modern R toolkit for mixed models.
First, read the section on modelsummary. Note the author's key finding that modelsummary will not work with mixed models from the lmerTest package (a common alternative to lme4) unless broom.mixed is loaded first. Next, review the gtsummary section. The author encounters an error when trying to create a table, which is resolved by explicitly telling the tbl_regression function to use broom.mixed to do the tidying: tidy_fun = broom.mixed::tidy. This demonstrates that broom.mixed is the engine that enables these powerful reporting tools.
By using broom.mixed, these packages can generate beautifully formatted tables that clearly separate fixed and random effects, include confidence intervals and p-values, and can even place multiple models side-by-side for comparison.
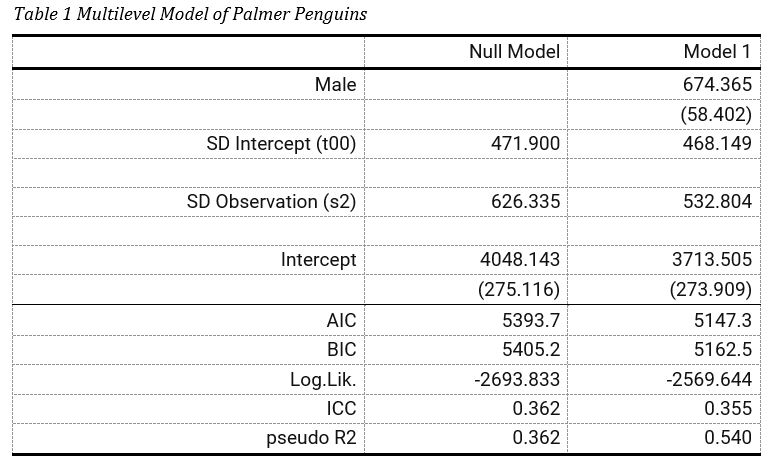
An example of a publication-quality table created with the modelsummary package, which relies on broom and broom.mixed to extract model results into a structured format.

Another example showing tidied model outputs from three different tests. This clean, consistent format is the direct result of using a tidying function like broom.mixed::tidy().
Beyond a Single Model
The true power of the tidy workflow becomes apparent when you work with many models. Imagine you have run a separate model for each gene in a genomic study, or for each country in a global health dataset. Because tidy() returns a data frame, you can run it on every model, and then stack the results into one large data frame for analysis and visualization. This is a workflow that combines purrr::map() with broom::tidy(), a pattern you may have seen before.
Just use multilevel models for your pre/post RCT data
This post by Solomon Kurz demonstrates a sophisticated simulation study where this exact pattern is used.
Please find the code chunk defining the sim_fit function. You don't need to understand the whole simulation, but scroll to the end of that function, right under the # summarize comment. Notice how the author uses broom.mixed::tidy() on two different lmer models (l1 and l2) and uses bind_rows() to combine their tidy results into a single data frame. This is a powerful, scalable approach to model comparison.
This ability to programmatically extract, combine, and analyze results from dozens or even thousands of models is central to modern, reproducible research and directly aligns with your goal of building an "extravagant" and industry-ready skill set.
Conclusion
In this lesson, you have learned one of the most important "glue" skills in the R data analysis ecosystem. You now understand the problem of messy model objects and how the broom and broom.mixed packages provide an elegant solution. By converting model outputs to tidy data frames, you unlock the ability to seamlessly integrate your statistical modeling results with the powerful tidyverse tools for manipulation, visualization, and reporting.
Key Takeaways:
- Standard R model objects are "messy," making it difficult to programmatically extract results.
- The
broompackage solves this by converting model objects into tidy data frames. - The
broom.mixedpackage extends this capability to handle complex mixed-effects models fromlme4. - The
tidy()function is your primary tool for extracting model components (coefficients, variance components) into a clean, multi-row data frame. - The output of
tidy()is the essential ingredient used by packages likemodelsummaryandgtsummaryto create publication-quality tables. - Combining
tidy()with functional programming tools likepurrr::map()enables powerful, scalable analysis of multiple models.
Preview of the Next Lesson:
You have now completed the entire modeling workflow, from data import and transformation to advanced modeling and reporting. In our final module, we will zoom out to focus on the entire project. In the next lesson, you will learn how to structure your analyses for maximum reproducibility and ease of collaboration using the workflowr package, ensuring that your work is not only correct but also transparent and shareable.