Welcome to the final module of our course! Over the past eleven modules, you have built a powerful toolkit for data analysis in R. You've journeyed from the basics of syntax to the intricacies of mixed-effects modeling and learned how to extract and report your results professionally using broom.mixed. You now have the skills to execute the core components of a sophisticated data analysis project.
In this capstone module, we will zoom out from the individual tasks of data manipulation, visualization, and modeling to focus on the entire project workflow. Your goal is to produce high-quality, publication-ready analyses for clinical research. To achieve this, your work must not only be statistically sound but also transparent, credible, and robust against errors. This lesson addresses the "why" behind this principle. We will explore the benefits of adopting a structured, reproducible project workflow, setting the stage for the practical tools you will learn in the upcoming lessons.
The Problem of Irreproducible Research
In science, and especially in medicine, a result is only as valuable as it is trustworthy. A central component of that trust is reproducibility—the ability for another researcher, or even your future self, to take the same data and code and arrive at the same results. Unfortunately, a significant portion of published research, even in top journals, fails to meet this standard.
This "reproducibility crisis" is not typically about fraud. It's about honest mistakes, opaque methods, and fragile analysis pipelines that make it difficult to verify findings. For a medical student like yourself, the implications are profound, as non-reproducible research can misdirect future studies, inform poor policy, and ultimately impact patient care.
Reproducible data analysis workflows with R and RStudio
This article from the Stats Epi blog provides a compelling, real-world introduction to why this topic is so critical, particularly in a health context.
Please read the introduction and the section titled "What’s the worst that can happen?". Pay close attention to the examples of simple errors that led to retracted papers and incorrect conclusions. These cases highlight the high stakes of data analysis in our field.
As the article makes clear, simple clerical errors can completely reverse a study's conclusions. These are not complex statistical misunderstandings but failures in the data analysis process.
Defining Our Goal: The Reproducibility Spectrum
To address this problem, it's useful to be precise with our language. The terms reproducibility, replicability, and repeatability are often used interchangeably, but they describe different levels of scientific rigor.
Get Around Reproducibility Issues In Research
This article provides clear definitions adopted by the scientific community to distinguish these concepts.
Focus on the section "Reproducibility vs. Replicability". Read the definitions for Repeatability, Replicability, and Reproducibility.
To summarize:
- Repeatability: Same team, same setup. Can I get the same result again?
- Replicability: Different team, same setup. Can you get the same result using my exact method?
- Reproducibility: Different team, different setup. Can you get the same result using your own methods to test my hypothesis?
In this course, our focus is primarily on replicability: ensuring that your analysis code, when run on your data, will produce the exact same figures, tables, and statistics for anyone, anywhere, anytime. This is the foundation upon which scientific trust is built.

The Anatomy of a Non-Reproducible Project
So, why do analyses fail to be replicable? The errors typically fall into three categories.
1. The Point-and-Click Problem
Many researchers use graphical user interface (GUI) software where analyses are done by clicking buttons. While user-friendly, this approach leaves no audit trail. It is impossible to know the exact sequence of clicks, data manipulations, or option settings that led to the final result. If a mistake was made, it's nearly impossible to find.
The single most important step you can take to make your work reproducible is to script your analysis. By writing code in R for every step—from data import and cleaning to modeling and visualization— you create a complete, unambiguous record of your work.
R programming for beginners - Why you should use R
This short clip effectively summarizes the core value of using code for analysis.
Watch the segment from this video, which explains how coding makes your analysis both reproducible and repeatable.
2. The "It Worked on My Machine" Problem
A script is necessary, but not sufficient. You might share your script with a collaborator, only for them to report that it crashes or gives different results. This often happens because their environment is different from yours. They might have a different version of R or, more commonly, different versions of the packages you used (dplyr, ggplot2, lme4, etc.).
Package developers are constantly updating their software, sometimes introducing changes that can alter a function's behavior or even break old code. If your project relies on a shared, system-wide library of R packages, every time you update a package for one project, you risk breaking another.
Kevin Ushey | renv: Project Environments for R | RStudio (2020)
This talk by Kevin Ushey, the author of the renv package, provides a perfect explanation of this "dependency hell" problem.
First, watch the introduction here, which frames the problem with relatable frustrations. Then, watch the segment from the video that explains the challenge of shared libraries and presents the core solution: giving each project its own isolated, independent library of packages.
A structured workflow must therefore include dependency management: a way to record the exact package versions used in a project and restore that specific environment anywhere.
3. The Disorganized Project Problem
Where is the raw data? Which script should be run first? Is the final analysis in analysis_v3.R, analysis_final.R, or analysis_final_for_real_this_time.R? A messy folder with inconsistently named files is a recipe for confusion and error. A reproducible project requires a logical and consistent directory structure.
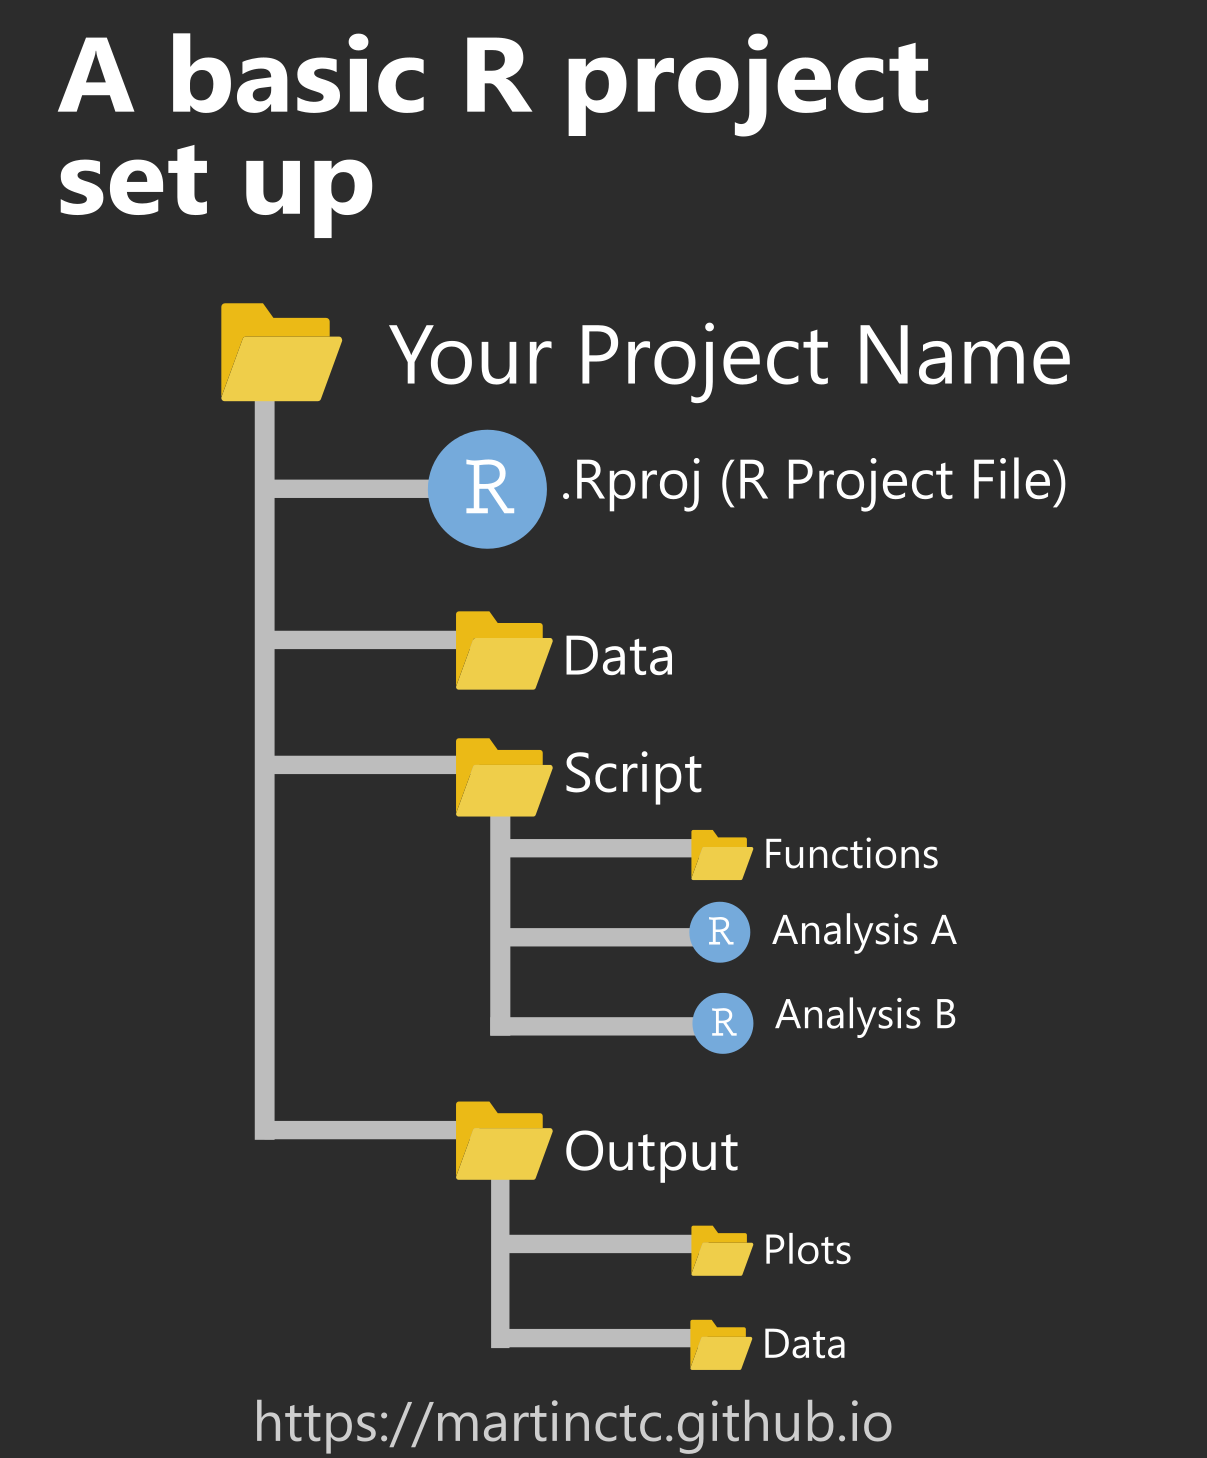
The Benefits of a Structured Workflow
By addressing these three problems, a structured, reproducible workflow provides immense benefits that directly support your goal of producing professional-grade research.
- Trustworthiness: When your entire analysis—from raw data to final report—can be re-run with a single command, it creates a transparent and verifiable audit trail. This builds confidence in your findings for yourself, your supervisors, your peer reviewers, and the scientific community. You are taking complete responsibility for your work.
- Efficiency: A scripted and organized workflow makes your analysis repeatable. When a reviewer asks for a minor change, or you receive new data six months later, you don't have to remember a complex series of manual steps. You simply update the relevant part of the script and re-run the entire project. This saves enormous amounts of time and prevents new errors from creeping in.
- Collaboration: A standardized structure makes it easy for collaborators to understand your project and contribute. When combined with version control systems like Git (which we'll cover in this course), multiple people can work on the same project without overriding each other's work.
- Error Correction: Mistakes are inevitable. A structured workflow makes them easier to find and fix. Because every step is scripted and the project is self-contained, you can systematically debug the process. Once fixed, you can regenerate the entire analysis with confidence, knowing the correction has been applied everywhere.
Conclusion
In this lesson, we have explored the motivation behind adopting a formal project workflow. You learned about the "reproducibility crisis" and saw how simple, preventable errors can undermine scientific findings. By understanding the core problems of opaque methods, unstable software environments, and project disorganization, you can now appreciate the profound benefits of a structured approach.
Key Takeaways:
- Reproducibility is a cornerstone of scientific trust, especially in fields with clinical impact.
- Most irreproducible results stem from process failures and honest mistakes, not fraud.
- A structured workflow addresses these failures through three main pillars:
- Scripted Analysis: Creating a transparent record of your work.
- Dependency Management: Ensuring a stable and consistent software environment.
- Standardized Organization: Making your project logical and easy to navigate.
- The primary benefits are trustworthiness, efficiency, ease of collaboration, and robust error-proofing.
You have seen why a structured workflow is essential. In our next lesson, we will begin learning how to implement one. You will be introduced to the workflowr package, a powerful tool that combines R Markdown, version control with Git, and a standardized project structure to help you build a version-controlled, website-based report of your analysis from the ground up.