Welcome to the next lesson in our journey through the foundations of statistical inference. In our previous session, we explored how to quantify the relationship between two variables using correlation coefficients. You learned that the cor.test() function in R not only gives you a correlation coefficient and a p-value but also something called a "95% confidence interval." Today, we will dissect this crucial concept.
This lesson is dedicated to interpreting confidence intervals (CIs). A CI provides a range of plausible values for a population parameter, such as a mean or proportion, based on your sample data. Understanding CIs is fundamental for anyone involved in clinical research, as it allows you to move beyond the simple "yes/no" verdict of a p-value and instead appreciate the precision and clinical relevance of your findings.
We will start by defining what a confidence interval is and what factors influence its size. Then, we will tackle the most critical and often misunderstood part: the correct way to interpret a CI. Finally, we'll briefly explore a powerful alternative from Bayesian statistics—the credible interval—which offers a more intuitive interpretation and aligns with your goal of building a deep theoretical foundation.
1. What is a Confidence Interval?
When you conduct a study, you typically work with a sample of the population. If you calculate a statistic from this sample, like the average reduction in blood pressure, you get a single number—a point estimate. However, if you were to take a different sample, you would likely get a slightly different point estimate. A confidence interval accounts for this sampling variability by providing a range of values that likely contains the true, unknown population parameter.
This short video provides an excellent overview of CIs from a clinical research perspective, explaining why they are more informative than p-values alone.
5 Minutes statistics for clinical research - Confidence Intervals
This video from the GCP-Mindset channel introduces the role of confidence intervals in clinical trials.
Please watch the following segments: The introduction explains why interval estimates are generally preferred over point estimates. The next section discusses the factors that influence the width of a CI. Finally, watch the conclusion, which summarizes the value of CIs for assessing clinical relevance.
As the video highlighted, the width of the confidence interval tells you about the precision of your estimate. A narrow interval suggests a precise estimate, while a wide interval indicates more uncertainty. The width is influenced by three key factors:
- Sample Size: Larger samples produce narrower, more precise CIs.
- Data Variability: Less variation (i.e., a smaller standard deviation) in the data leads to a narrower CI.
- Confidence Level: A higher confidence level (e.g., 99% vs. 95%) results in a wider interval. This is a trade-off: to be more confident that your interval contains the true value, you must accept a less precise range.
The following resource, from a journal focused on evidence-based practice in a clinical field, elaborates on these points.
Understanding and interpreting confidence and credible ...
This article from the Brazilian Journal of Physical Therapy is tailored to clinicians and researchers.
Read the section "What are confidence intervals?" to solidify your understanding of what a CI represents and the factors that determine its width.
2. The Frequentist Interpretation: Getting it Right
This is the most critical part of our lesson, as the correct interpretation of a confidence interval is subtle and widely misunderstood.
Consider the image below. It presents a common visualization of a 95% confidence interval.

The statement in the image is what many people intuitively think a 95% CI means. However, in the frequentist school of statistics (which is the framework for this course), this interpretation is wrong.
The following short video does an excellent job of explaining this common pitfall and providing the correct interpretation.
Interpreting Confidence Intervals EXPLAINED in 3 Minutes with Examples
This video from Ace Tutors focuses specifically on the correct way to interpret a CI.
Watch the entire video. Pay close attention to the distinction between the incorrect interpretation ("95% chance") and the correct, formal definition related to repeating an experiment. Also, note the useful shorthand version that uses the word "confident."
To summarize the video's key point: in frequentist statistics, the true population parameter (e.g., the true average height of all men) is considered a fixed, unknown constant. Your calculated confidence interval is what's random—it depends entirely on the specific sample you happened to collect. Therefore, once you have a CI, the true parameter is either inside it or it isn't. There's no probability involved for that single interval.
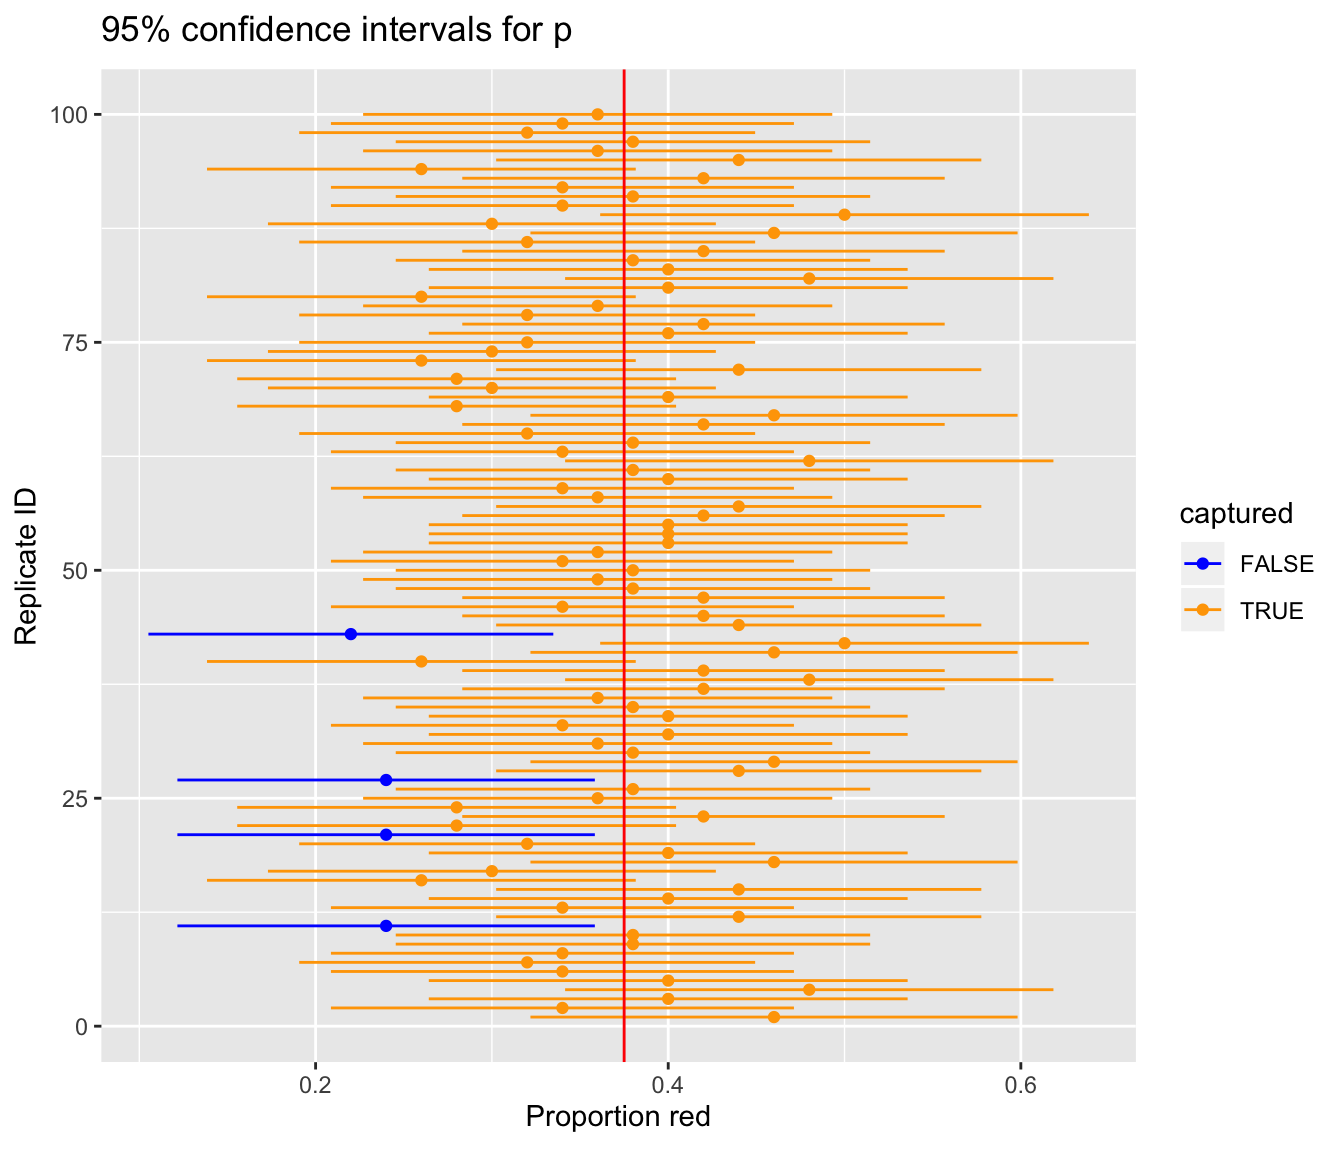
The 95% confidence refers to the long-run performance of the method. The correct interpretation is:
If we were to repeat our sampling process an infinite number of times and construct a 95% confidence interval for each sample, 95% of those intervals would capture the true population parameter.
Let's delve a bit deeper with a reading that makes this distinction crystal clear.
Confidence Intervals for Descriptive Statistics
This resource from a data science course provides a detailed breakdown of the frequentist interpretation.
In the "Introduction to a Confidence Interval (CI)" section, read the subsection titled "Correct and incorrect interpretations". This reinforces the core idea that the 95% reflects the reliability of the method, not the probability that a single, specific interval contains the true parameter.
The image below provides a perfect visual representation of this "long-run frequency" concept. Imagine we simulated drawing 100 different samples from a population and calculated a 95% CI for each.
3. Using Confidence Intervals in Practice
While the formal interpretation is important, in practice, you also need to know how to use CIs to draw conclusions from research papers.
Assessing Statistical Significance
Confidence intervals provide a straightforward way to assess statistical significance. The rule depends on the type of effect you are measuring:
- For an effect measured as a difference (e.g., the mean difference in pain scores between a treatment and a placebo group), if the CI does not contain 0, the result is statistically significant.
- For an effect measured as a ratio (e.g., a relative risk or an odds ratio), if the CI does not contain 1, the result is statistically significant.
Assessing Clinical Relevance
This is where CIs truly shine over p-values. A p-value only tells you if there is a statistically significant effect, but it says nothing about the size or importance of that effect. The CI gives you a range of plausible values for the effect size. By examining the lower and upper bounds of the interval, you can judge whether the effect is large enough to be clinically meaningful. A statistically significant result with a CI that includes only tiny, clinically irrelevant effects may not be worth implementing in practice.
The following reading provides a fantastic, practical example of this.
Understanding and interpreting confidence and credible ...
This article shows how to use CIs to assess both statistical significance and clinical relevance in a research context.
First, read the section on interpreting CIs and review the paragraph that begins "Regarding statistical significance" to understand the rules for checking significance. Then, read the "Illustrative example" to see how to interpret a CI from a real clinical trial, considering both statistical significance and the clinical magnitude of the effect.
4. An Alternative: Bayesian Credible Intervals
You've probably noticed that the formal frequentist interpretation of a CI is not very intuitive. The interpretation that "there is a 95% chance the true value is in the interval"—while incorrect for a frequentist CI—is actually how many people naturally think about uncertainty.
This is where Bayesian statistics comes in. It's a different school of thought that defines probability as a "degree of belief." A key output of a Bayesian analysis is a credible interval.
A 95% Bayesian credible interval can be interpreted as:
"Given our data and prior beliefs, there is a 95% probability that the true population parameter lies within this interval."
This is the "extravagant build" part of our lesson. While this course primarily uses the frequentist approach, it's valuable for you, as a future researcher, to be aware of this major alternative framework and its more intuitive interpretation of uncertainty.
Understanding and interpreting confidence and credible ...
Let's conclude by contrasting the frequentist CI with its Bayesian counterpart.
Read the sections "Interpreting Bayesian CrIs" and "Advantages of using Bayesian CrIs". This will give you a clear understanding of how the interpretation differs and why many find the Bayesian approach more natural.
Conclusion
In this lesson, you've learned to interpret one of the most fundamental tools in statistics. You now understand that a confidence interval provides a range of plausible values for an unknown population parameter and that its width reflects the precision of your estimate.
Key Takeaways:
- A confidence interval (CI) gives a range of plausible values for a population parameter, quantifying the uncertainty around a point estimate.
- The frequentist interpretation states that if you were to repeat an experiment many times, 95% of the 95% CIs you calculate would contain the true parameter. The confidence is in the method, not in a single interval.
- It is incorrect to say "there is a 95% probability that the true parameter is in this specific CI." The acceptable shorthand is "we are 95% confident that the true parameter is in the interval."
- CIs are used to assess both statistical significance (does the interval contain the null value?) and clinical relevance (is the range of effects meaningful in practice?).
- Bayesian credible intervals offer a more intuitive interpretation, stating the probability that the true value lies within the interval.
Preview of the Next Lesson:
We've now covered several key concepts for describing and exploring data: assessing distributions, calculating correlations, and quantifying uncertainty with confidence intervals. In the next lesson, we will introduce a practical tool that helps ensure your data is sound before you even begin your analysis. You will learn how to use the assertthat package to make and test explicit assumptions about your data, helping you catch errors early and build more robust and reliable analysis workflows.