Introduction
In our last session, we explored how to engineer new columns in your data using mutate() and case_when(), a crucial skill for preparing clinical data. You learned to create risk categories and calculate new metrics, effectively adding more informational depth to your dataset.
Today, we will focus on bringing order to that information. This lesson covers the dplyr function arrange(), which allows you to sort the rows of your data frame. This might seem simple, but it's a fundamental part of data exploration and reporting. Sorting allows you to quickly identify extremes—such as the patients with the highest or lowest biomarker values—or to prepare a table for a report where a logical order (e.g., by patient ID, then by visit date) is essential for readability. This directly supports your goal of preparing data for statistical analysis and creating clear, publication-quality outputs.
By the end of this lesson, you will be able to sort your data frames by one or more columns in either ascending or descending order, giving you precise control over how you view and present your data.
1. The Basics: Ascending and Descending Order
The primary function for sorting rows in dplyr is arrange(). By default, it sorts the data based on the column you specify in ascending order (from smallest to largest for numbers, or alphabetically for characters).
To sort in descending order (from largest to smallest), you wrap the column name in the desc() helper function. This is a very common pattern you'll use to find the "top" values in your dataset.
The PsyTeachR book, which we used in the previous lesson, provides a clear, activity-based introduction to these core concepts.
4 Data wrangling 1: Join, select, and mutate – Fundamentals of Quantitative Analysis
This reading will walk you through the fundamental syntax for both ascending and descending sorts.
Please read the section "4.5 Arranging variables of interest with arrange()". First, read "4.5.1 Activity 6 - Arranging in ascending order" to see how arrange() works by default. Focus on the simple syntax: the arrange() call. Next, read "4.5.2 Activity 7 - Arranging in descending order" to learn how to reverse the sort order. Pay close attention to how the desc() function is used inside arrange().
2. Sorting by Multiple Columns
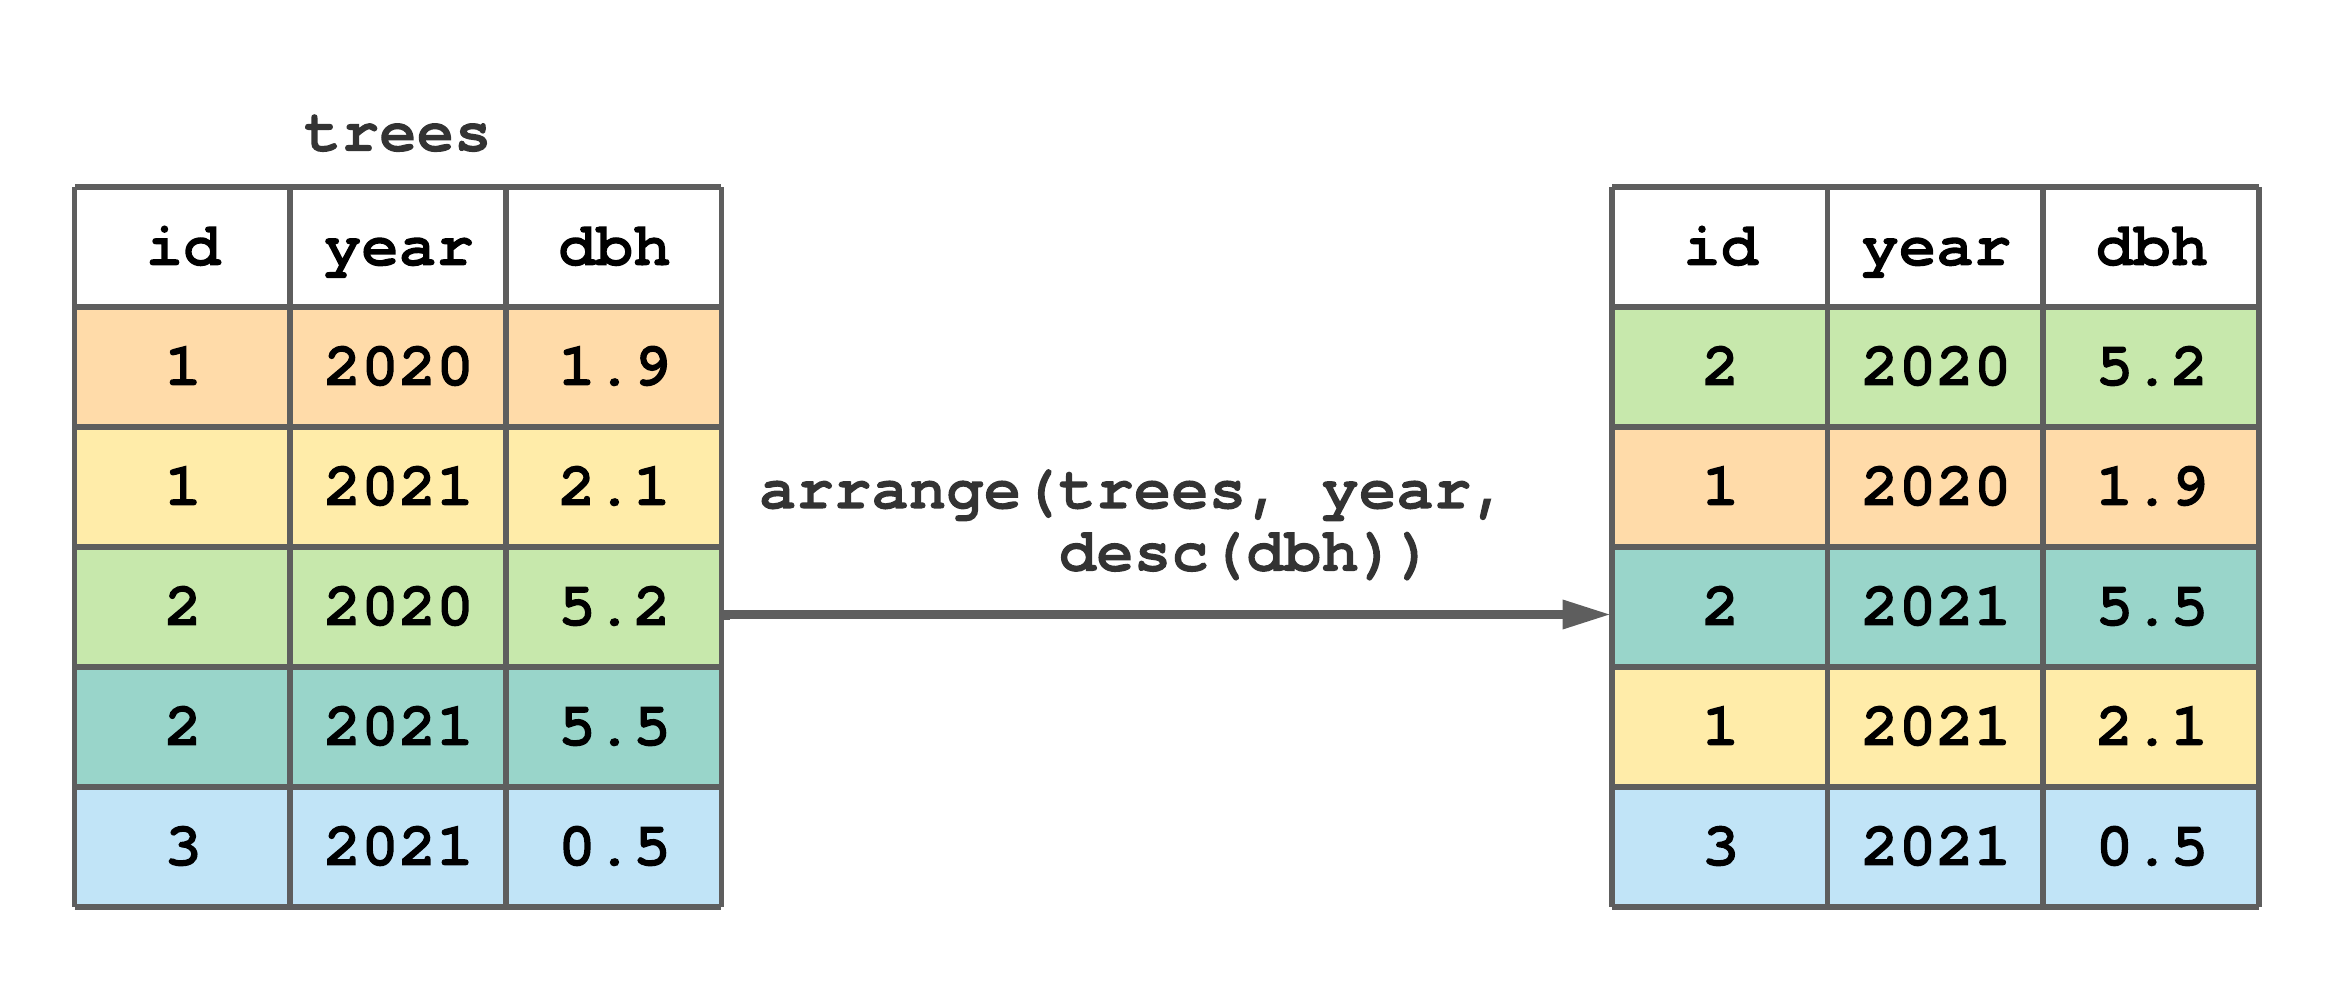
The real power of arrange() becomes apparent when you need to impose a more complex order on your data. In research, you often need to sort by one variable and then use another to "break ties." For example, you might want to list patients by risk group, and within each risk group, sort them by age.
To do this, you simply provide the column names to arrange() in the order of priority. arrange() will sort by the first column, then use the second column to sort any rows that had the same value in the first column, and so on. You can also mix ascending and descending orders for different columns.
The image below provides a perfect visual summary of this process.
Let's see another practical example of this in the PsyTeachR guide.
4 Data wrangling 1: Join, select, and mutate – Fundamentals of Quantitative Analysis
This activity demonstrates how to combine multiple sorting criteria, a technique you'll use frequently.
Return to the PsyTeachR chapter and read "4.5.3 Activity 8 - Sorting by multiple columns". Focus on the example where the data is sorted to find the oldest female participant. Notice how sex is the first argument (the primary sort) and desc(age) is the second (the tie-breaker).
For a quick video demonstration of this same principle, you can watch this clip.
Dplyr Essentials (easy data manipulation in R): select, mutate, filter, group_by, summarise, & more
This segment from Dataslice provides a concise demonstration of sorting by multiple columns to break ties.
Watch the short clip from this point. The presenter first arranges songs by popularity in descending order, and then adds a second column, song title, to sort the songs alphabetically when they have the same popularity score. This clearly shows the tie-breaking mechanism in action.
3. A Note on Missing Values
A practical question that often arises is: where do missing values (NA) go when you sort? In dplyr, the arrange() function has a consistent and convenient rule: NA values are always placed at the end of the sorted output. This is true whether you are sorting in ascending or descending order. This behavior is generally what you want, as it separates the complete cases, which you are often most interested in, from the incomplete ones.
For example, if you arrange(my_data, Age), all rows with a non-missing Age will come first, sorted from youngest to oldest, followed by all rows where Age is NA. If you arrange(my_data, desc(Age)), the non-missing rows will be sorted from oldest to youngest, and again, the rows with NA for Age will be at the very end.
4. Let's Practice
Now it's time to apply arrange() to the blood_storage_modified data frame we created in the last lesson. Open your clinical-trial-practice RStudio Project and create a new R script named 11-arrange-rows.R.
-
Load packages and recreate the data. Add this code to your script and run it to get our starting data frame. This is the same code from the end of the previous lesson.
library(tidyverse) library(medicaldata) blood_storage_modified <- blood_storage %>% mutate( PSADensity = PreopPSA / PVol, AgeCat = case_when( Age < 70 ~ "Under 70", Age >= 70 ~ "70 and over" ), PSARisk = case_when( is.na(PreopPSA) ~ "Unknown", PreopPSA < 10 ~ "Low", PreopPSA <= 20 ~ "Intermediate", PreopPSA > 20 ~ "High" ) ) -
Your Tasks: Write piped operations to answer the following questions. You don't need to save the results to new objects unless you want to; just printing the sorted output to the console is enough to see the answer.
-
Task 1: Find the Highest PSA Density. Sort the
blood_storage_modifieddata frame to show the patients with the highestPSADensityat the top. Display the top 5 rows of this sorted data frame. Hint: you can pipe yourarrange()command intohead(5). -
Task 2: Examine Age Within Risk Groups. Sort the data first by the
PSARiskgroup in its natural alphabetical order ("High", "Intermediate", "Low", "Unknown"). Then, within each risk group, sort the patients byAgefrom oldest to youngest. This would help you quickly identify the oldest patients in the "High" risk category, for example.
Click here to see the solution
# Task 1: Find the patients with the highest PSA Density blood_storage_modified %>% arrange(desc(PSADensity)) %>% head(5) # --- Output would look something like this --- # # A tibble: 5 × 12 # PtID Vesinv [...] AgeCat PSARisk PSADensity # <dbl> <fct> [...] <chr> <chr> <dbl> # 1 156 No [...] 70 and over High 3.21 # 2 218 No [...] Under 70 High 2.17 # 3 212 No [...] 70 and over High 1.91 # 4 360 No [...] 70 and over High 1.53 # 5 366 No [...] Under 70 High 1.48 # Note: The output has been simplified for clarity. # Also, notice the NAs in PSADensity are not at the top. # Task 2: Sort by risk group, then by age descending blood_storage_modified %>% arrange(PSARisk, desc(Age)) # If you run this, you will see the data is first grouped by PSARisk ('High', 'Intermediate', etc.) # and within each of those blocks, the ages are sorted from largest to smallest. -
Conclusion
In this lesson, you've added another essential dplyr verb, arrange(), to your data wrangling toolkit. You now have the power to not just select, filter, and create data, but also to order it in a logical and meaningful way. This is a critical step in exploring your data, checking the results of your transformations, and preparing data for presentation.
Key Takeaways:
arrange()sorts the rows of a data frame based on one or more columns.- By default,
arrange()sorts in ascending order. To sort in descending order, use thedesc()function around the column name. - You can sort by multiple columns to break ties;
arrange()uses them in the sequence you provide. - Missing values (
NA) are always sorted to the end of the output, regardless of the sort order.
Preview of the Next Lesson:
We have been building our data transformation skills piece by piece. You can select columns, filter rows, create new variables, and now, sort the entire dataset. In our next lesson, we will learn how to combine these operations with group_by() and summarise(). This will allow you to move from manipulating individual rows to calculating summary statistics for groups within your data—for instance, calculating the average age or median PSA level for each risk category you've created. Sorting is often a useful precursor to these kinds of grouped operations.