Introduction
In our last lesson, you began your journey into data transformation by learning how to manage columns with select() and rename(). This gave you the power to shape your dataset's width. Now, we'll turn our attention to its length by learning how to manage its rows.
This lesson focuses on dplyr::filter(), a fundamental function that lets you subset your data by keeping only the rows that satisfy conditions you specify. This skill is at the heart of data analysis, as it allows you to ask specific questions of your data. For your work in clinical research, this translates to queries like "Which patients are over 60 and have a history of smoking?" or "Which observations were recorded in the first week of the study?". By the end of this lesson, you will be able to filter your data frames based on one or more conditions, bringing you a significant step closer to performing targeted analyses.
1. The Core Idea: Filtering with Logical Conditions
The filter() function works by applying a logical test to each row of your data. It keeps the rows where the test returns TRUE and discards the rows where it returns FALSE. This simple principle is incredibly powerful.
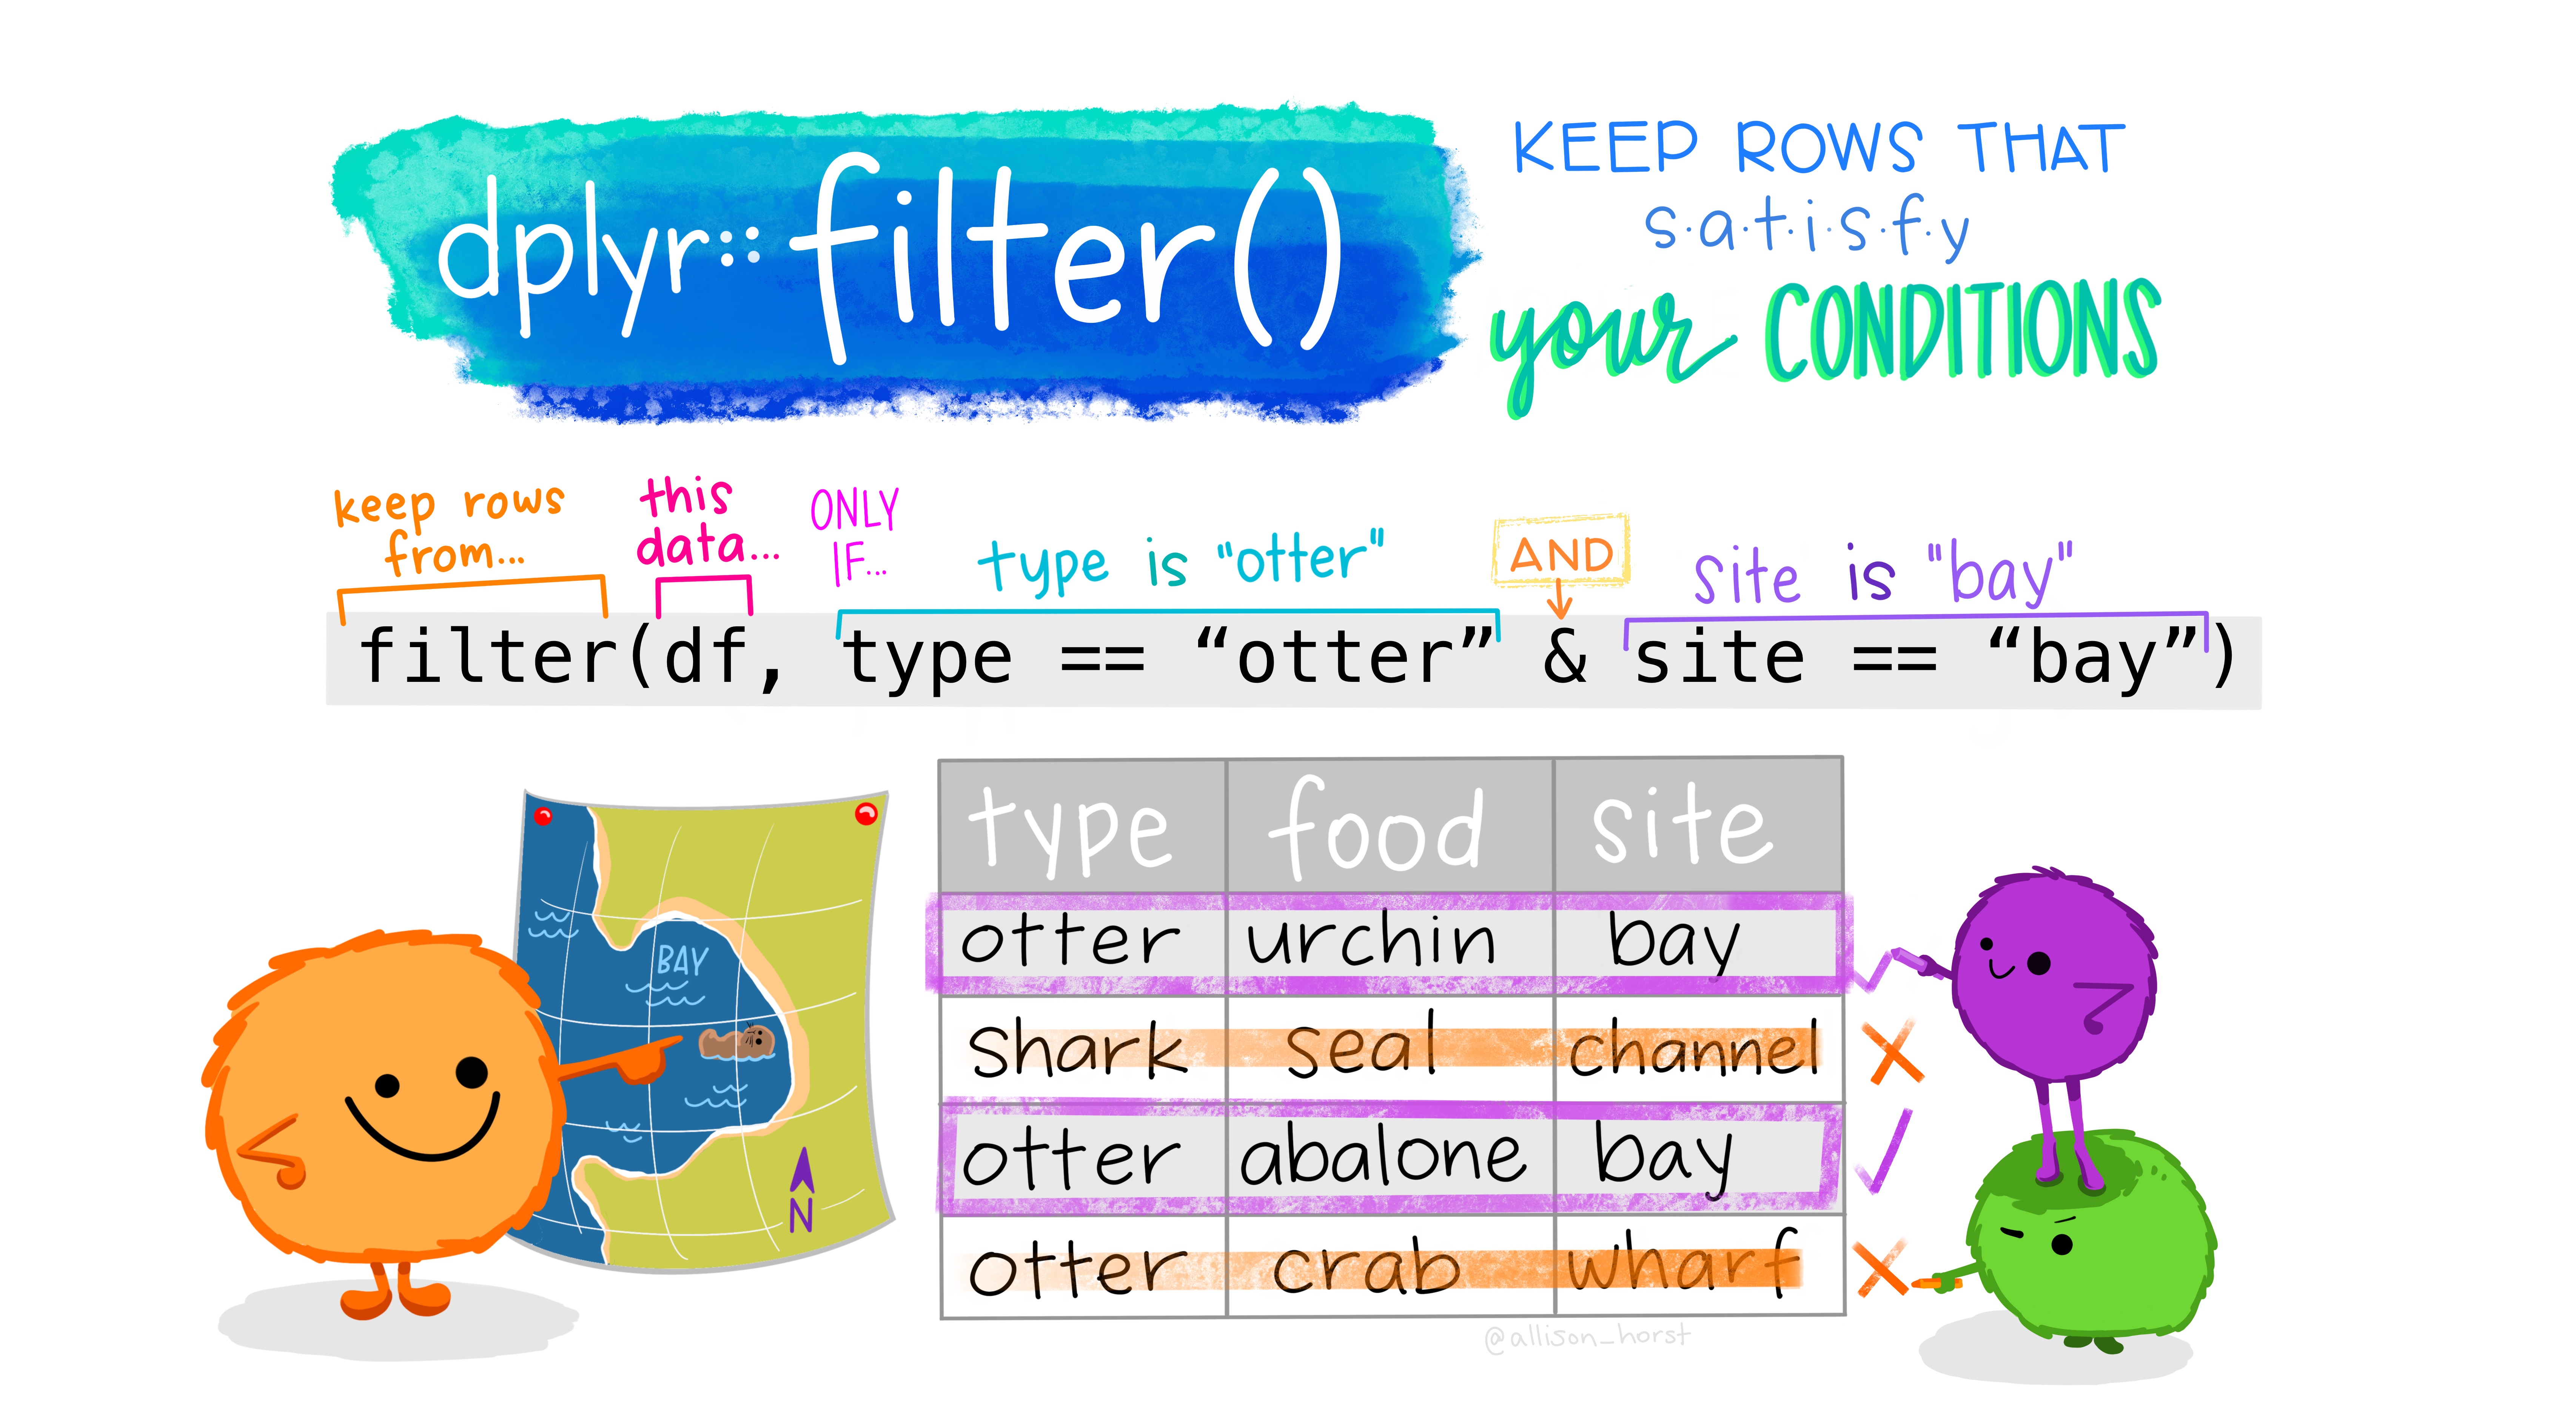
To effectively use filter(), you need to be comfortable writing these logical conditions. A condition is simply an R expression that evaluates to TRUE or FALSE. Let's explore the building blocks for these expressions.
Chapter 6 Wrangling Rows in R with Filter - Bookdown
This chapter from "Reproducible Medical Research with R" explains the foundation of filtering and the operators you'll use. It uses medical data, making it directly relevant to your goals.
First, read the section on "Logical Statements in R" to understand how R evaluates conditions. Focus on the core idea that each row is tested and results in a TRUE or FALSE. Next, read "Filtering on Numbers". Pay close attention to the list of comparison operators like greater than, less than, and equal to. Crucially, note that testing for equality uses a double equals sign (==), not a single one (=). A single equals is for assignment, a common mistake for beginners. Also, review the table summarizing different filtering examples, such as filter(recurrence == 1).
2. Combining Multiple Conditions
Real-world data analysis rarely involves a single condition. You'll more likely need to combine several criteria. For instance, you might need to find patients who are both over 65 years old and belong to a specific treatment group, or patients who have either condition A or condition B.
dplyr allows you to specify multiple conditions within a single filter() call using boolean operators:
&or a comma (,) for AND: All conditions must beTRUE.|for OR: At least one condition must beTRUE.!for NOT: Reverses a condition (e.g., keeps rows that do not match).
The following video provides a clear, step-by-step walkthrough of how to use these operators.
10 data filtering tips using R programming. Use the tidyverse to filter and subset your data.
This video from the R Programming 101 channel offers concise tips for filtering data. We'll focus on the segments covering multiple conditions.
Please watch these three short segments: AND: Watch from this segment to see how to filter for rows where multiple criteria are met. The presenter uses a comma, which in filter() is equivalent to using &. OR: Next, watch from this part to understand how to use the vertical bar (|) to keep rows if either of the conditions is true. NOT: Finally, watch from this clip to see how the exclamation mark (!) is used to negate a condition, keeping rows that don't match.
3. Efficient Filtering Helpers
While & and | are powerful, chaining many OR conditions can become cumbersome. For example, to find patients from study sites 'A', 'B', 'D', and 'F', you would have to write:filter(site == 'A' | site == 'B' | site == 'D' | site == 'F')
dplyr provides more elegant solutions for common scenarios like this.
%in%: To check if a value is present in a list of options. The example above becomes much cleaner:filter(site %in% c('A', 'B', 'D', 'F')).between(): To check if a numeric value falls within a range, inclusive of the endpoints. For example,filter(between(age, 60, 70))is a more readable equivalent offilter(age >= 60 & age <= 70).
10 data filtering tips using R programming. Use the tidyverse to filter and subset your data.
Let's return to the "10 data filtering tips" video to see these helper functions in action.
Watch the following two segments: Using %in%: From this point, you'll see how to filter for observations where a variable matches any value within a specified set. Using between(): Watch from here to learn how to efficiently filter for values that fall within a numeric range.
4. A Special Case: Handling Missing Values (NA)
In any real dataset, especially clinical data, you will encounter missing values, represented in R as NA. These values behave in a special way. A logical comparison involving an NA (e.g., NA > 60) doesn't result in TRUE or FALSE; it results in NA. Because filter() only keeps TRUE rows, observations with missing values in the columns you are filtering on will be automatically dropped.
Sometimes you want to explicitly find or remove rows with missing data. To do this, you must use the special function is.na().
filter(is.na(column_name))will keep only the rows wherecolumn_nameis missing.filter(!is.na(column_name))will keep only the rows wherecolumn_nameis not missing.
This is a critical technique for data cleaning and validation.
Chapter 6 Wrangling Rows in R with Filter - Bookdown
The "Reproducible Medical Research with R" chapter has an excellent section on this topic.
Please read the section "Filtering Out or Identifying Missing Data". Focus on the examples that use is.na() and !is.na() within a filter() call. This is the standard way to handle missing values as a condition. The text also mentions drop_na(), a related function we will explore in a later lesson.
5. Let's Practice
Time to apply these concepts. We will continue working with the blood_storage dataset from the medicaldata package.
Open your clinical-trial-practice RStudio Project and create a new R script named 09-filter-rows.R.
-
Load packages and data. Add this code to your script and run it.
library(tidyverse) library(medicaldata) # We will use the 'blood_storage' dataset glimpse(blood_storage) -
Your Tasks: Create new data frames by writing a piped operation for each task below. Inspect the resulting data frame after each step to ensure your code worked as expected.
-
Task 1: Older Male Patients with Recurrence. Create a data frame called
older_male_recurrencethat contains only male patients (Sex == 1) older than 75 who experienced a recurrence (Recurrence == 1). -
Task 2: Patients from Specific Age Groups. Create a data frame called
specific_age_groupscontaining patients from RBC age groups 3, 4, or 5. Use the%in%operator for this. -
Task 3: Patients with Mid-range PSA and No Pre-op Therapy. Create a data frame called
mid_psa_no_therapy. This should include patients whose pre-operative PSA (PreopPSA) was between 20 and 50 (inclusive) AND who did not receive pre-operative therapy (PreopTherapy == 0). -
Task 4: Patients with Missing PSA values. Create a data frame called
missing_psathat contains only the patients for whom thePreopPSAvalue isNA.
Click here to see the solutions
# Task 1 Solution older_male_recurrence <- blood_storage %>% filter(Sex == 1, Age > 75, Recurrence == 1) glimpse(older_male_recurrence) # Task 2 Solution specific_age_groups <- blood_storage %>% filter(RBC.Age.Group %in% c(3, 4, 5)) glimpse(specific_age_groups) # Task 3 Solution mid_psa_no_therapy <- blood_storage %>% filter(between(PreopPSA, 20, 50), PreopTherapy == 0) glimpse(mid_psa_no_therapy) # Task 4 Solution missing_psa <- blood_storage %>% filter(is.na(PreopPSA)) glimpse(missing_psa) -
This practice mirrors the daily work of a data analyst: starting with a broad dataset and progressively narrowing it down to answer specific, targeted questions.
Conclusion
In this lesson, you've added a crucial verb, filter(), to your data transformation vocabulary. You can now subset your data not just by columns (select) but also by rows based on specific, and even complex, criteria. This is the foundation of asking questions and exploring hypotheses with your data.
Key Takeaways:
filter()keeps rows where a logical condition evaluates toTRUE.- Use comparison operators (
>,<,==,!=) for basic conditions. Remember to use==for testing equality. - Combine conditions with boolean operators:
,or&for AND,|for OR, and!for NOT. - Use helper functions like
%in%andbetween()to write cleaner and more readable code for common filtering tasks. - Handle missing data explicitly using
is.na()to either find or excludeNAvalues.
Preview of the Next Lesson:
So far, you can select columns and filter rows. But what if you need to calculate a new variable from existing ones, like BMI from height and weight, or categorize patients based on a certain threshold? In our next lesson, we will cover mutate() and case_when(), the dplyr tools that allow you to create new columns and modify existing ones, adding another layer of power to your data wrangling skills.