Introduction
In our last lesson, you learned to impose order on your data with arrange(), sorting rows to identify extremes and prepare data for reporting. This gave you control over the presentation of individual data points. Now, we will take a significant step forward by learning how to calculate summary statistics for specific groups within your dataset.
This lesson introduces the powerful dplyr combination of group_by() and summarise(). This pairing is the cornerstone of the "split-apply-combine" strategy, a fundamental paradigm in data analysis. You will learn to split your data into meaningful subgroups (e.g., patients by risk category), apply summary functions to each (e.g., calculate the average age or median biomarker level), and combine the results into a new, concise summary table. This skill is absolutely essential for your goal of analyzing clinical research data, as it's the primary method for generating the descriptive statistics that form the basis of most research papers.
By the end of this lesson, you will be able to generate grouped summaries, a skill that transforms your ability from manipulating rows to deriving aggregate insights from your data.
1. The Core Idea: Split-Apply-Combine
Before diving into the code, it's crucial to understand the conceptual workflow. The process of generating a grouped summary involves three steps:
- Split: The data frame is conceptually split into smaller data frames, one for each unique value of the grouping variable(s) you specify. For instance, if you group by a
risk_groupcolumn with "Low," "Medium," and "High" values, you are creating three virtual subsets of your data. - Apply: A summary function (like
mean(),median(), or simply counting the number of rows withn()) is applied independently to each of these subsets. - Combine: The results from each subset are collected and combined into a new data frame. This summary data frame will have one row for each group.
This video from Ben Stenhaug provides an excellent conceptual breakdown of how group_by() and summarise() work together to achieve this.
Understanding group by (R Tidyverse)
This video builds the mental model for the split-apply-combine strategy piece by piece.
First, watch how summarise() works on its own, collapsing the entire dataset into a single row from this segment. Next, see the conceptual role of group_by(), which invisibly splits the data into logical groups, from this part. Finally, watch how they combine to create a summary for each group from this explanation.
The following diagram illustrates this entire process. The original data frame df is first grouped by cat1, creating three logical groups ('a', 'b', 'c'). Then, summarize() is applied to calculate the average of x, the sum of x, and the count of rows (n()) for each group, producing a new, compact summary table.

2. Syntax and Common Summary Functions
Now let's translate this concept into code. The workflow typically involves piping your data into group_by() and then into summarise().
A common task in clinical research is to summarize patient characteristics. This video from R Programming 101 walks through a practical example using the msleep dataset, demonstrating the full pipeline from data to summary table.
Group by and Summarise functions in R programming - use the tidyverse package to wrangle your data
This video provides a clear, step-by-step demonstration of the group_by() and summarise() syntax in a realistic data analysis context.
Watch the main demonstration from this section. Pay close attention to how the pipe (%>%) connects the data, the grouping variable, and the summary calculations. The presenter also uses drop_na() first, which is a good practice to remember.
As you saw, summarise() lets you create new columns for your summary data. Inside summarise(), you will use summary functions that collapse a vector of values into a single value. Some of the most common ones are:
mean(): calculates the average.median(): calculates the median.sd(): calculates the standard deviation.min()andmax(): find the minimum and maximum values.n(): counts the number of rows in the current group. This function is unique in that it doesn't take any arguments.
Handling Missing Values
A critical point when working with real-world data, especially clinical data, is handling missing values (NA). By default, most summary functions in R will return NA if even one value in the input is NA. This is a safety feature to prevent you from unknowingly calculating a summary on incomplete data. To override this, you must explicitly tell the function to remove missing values before calculation by setting the argument na.rm = TRUE.
The following reading demonstrates why this is so important.
Summarizing Data with dplyr - Introductory R for Novices
This guide provides clear examples of applying summary functions and dealing with missing data.
First, read the section that starts with the heading "na.rm". Focus on the two examples shown. The first one produces NAs because the na.rm argument is missing. The second one, which correctly uses na.rm=TRUE, produces the expected numeric summaries. Then, look at the "Additional Examples" section with the penguins data. Notice how every call to mean() or sd() includes na.rm = TRUE. This is a standard and necessary practice.
3. Grouping by Multiple Columns
Your research questions might require more granular summaries. For instance, you might want to know the average blood pressure not just for a treatment group, but for males and females within that treatment group. You can achieve this by passing multiple column names to group_by().
data %>% group_by(variable_1, variable_2) %>% summarise(...)
This creates subgroups for every unique combination of variable_1 and variable_2.
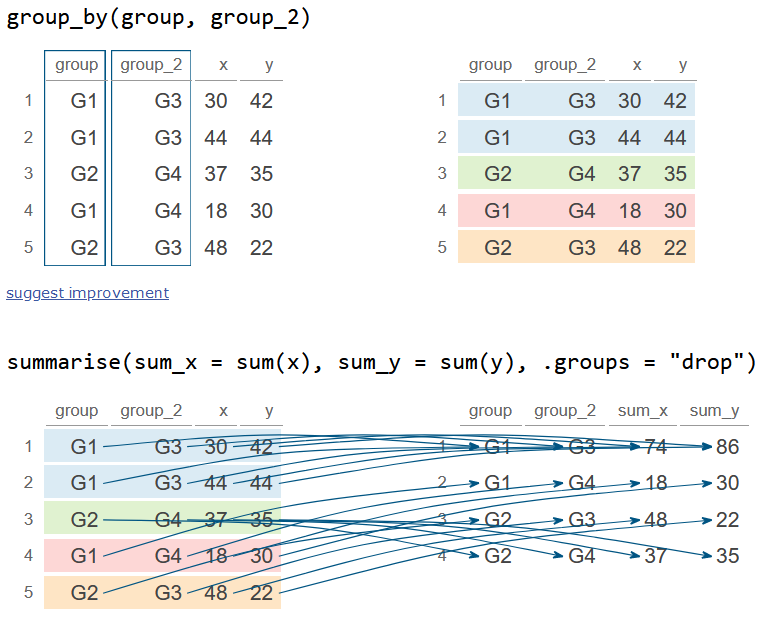
When you summarize data grouped by multiple columns, dplyr has a specific default behavior: it "peels off" only the last grouping variable. The resulting data frame remains grouped by the other variables. This can be useful for subsequent calculations but can also be surprising if you're not aware of it.
The blog post from Andrew Heiss provides an excellent explanation of this behavior and how to control it.
This resource explains the nuances of grouping, especially with multiple variables.
Start by reading the section "Summarizing groups with group_by() |> summarize()". This reinforces the core concept using the penguins dataset. Next, read "Summarizing multiple groups", which introduces the syntax for grouping by more than one column. Now for the crucial part: read "Leftover groupings and ungroup()". This explains what happens when you summarize with multiple groups and how the output can still be grouped. Pay close attention to the summarise() message and the different ways to handle this, such as using ungroup() or the .groups argument inside summarise(). Finally, review the tip box about the experimental .by argument, which offers a more direct way to group and summarize in one step without leftover groups.
4. Let's Practice
It's time to apply these concepts to our clinical data. Open your clinical-trial-practice RStudio Project and create a new R script named 12-grouped-summaries.R.
-
Load packages and recreate the data. Add this code to your script and run it. This brings in the
blood_storage_modifieddata frame we've been working with.library(tidyverse) library(medicaldata) blood_storage_modified <- blood_storage %>% mutate( PSADensity = PreopPSA / PVol, AgeCat = case_when( Age < 70 ~ "Under 70", Age >= 70 ~ "70 and over" ), PSARisk = case_when( is.na(PreopPSA) ~ "Unknown", PreopPSA < 10 ~ "Low", PreopPSA <= 20 ~ "Intermediate", PreopPSA > 20 ~ "High" ) ) -
Your Tasks: Write piped operations to create the following summary tables.
-
Task 1: Patient Counts and PSA by Risk Group. Create a summary table that shows, for each
PSARiskgroup, the number of patients (n), the meanPreopPSA, and the standard deviation ofPreopPSA. Name your new columnsn_patients,mean_psa, andsd_psa. Remember to handle missing values for thePreopPSAcalculations! This is a classic "Table 1" summary found in many clinical studies. -
Task 2: Prostate Volume by Age and Vesicle Invasion. Create a summary table that shows the median
PVol(Prostate Volume) for each combination ofAgeCatandVesinv(seminal vesicle invasion). Group by both variables. -
Task 3: Find the Deadliest Combination. The
sGScolumn represents the surgical Gleason score, a measure of cancer aggressiveness. Find the combination ofPSARiskandsGSthat has the highest averagePSADensity. Your final output should be a single row showing this combination and its average PSA density. Hint: This will require combininggroup_by(),summarise(), andarrange()from the last lesson.
Click here to see the solution
# Task 1: Patient Counts and PSA by Risk Group psa_summary <- blood_storage_modified %>% group_by(PSARisk) %>% summarise( n_patients = n(), mean_psa = mean(PreopPSA, na.rm = TRUE), sd_psa = sd(PreopPSA, na.rm = TRUE) ) print(psa_summary) # --- Output --- # # A tibble: 4 × 4 # PSARisk n_patients mean_psa sd_psa # <chr> <int> <dbl> <dbl> # 1 High 59 33.2 29.7 # 2 Intermediate 96 13.4 2.99 # 3 Low 187 6.12 1.93 # 4 Unknown 3 NaN NA # Note: The 'Unknown' group has NaN/NA because all its PreopPSA values are NA. # Task 2: Prostate Volume by Age and Vesicle Invasion pvol_summary <- blood_storage_modified %>% group_by(AgeCat, Vesinv) %>% summarise( median_pvol = median(PVol, na.rm = TRUE), .groups = "drop" # Good practice to drop all groups ) print(pvol_summary) # --- Output --- # # A tibble: 5 × 3 # AgeCat Vesinv median_pvol # <chr> <fct> <dbl> # 1 70 and over No 45.9 # 2 70 and over Yes 46.9 # 3 Under 70 No 40.4 # 4 Under 70 Yes 48.6 # 5 Under 70 NA 39.1 # Task 3: Find the deadliest combination deadliest_combo <- blood_storage_modified %>% group_by(PSARisk, sGS) %>% summarise( avg_psa_density = mean(PSADensity, na.rm = TRUE), .groups = "drop" ) %>% arrange(desc(avg_psa_density)) %>% head(1) # Get the top row print(deadliest_combo) # --- Output --- # # A tibble: 1 × 3 # PSARisk sGS avg_psa_density # <chr> <fct> <dbl> # 1 High 10 0.871 -
Conclusion
You have now mastered one of the most powerful and common operations in data analysis: generating grouped summaries. By combining group_by() and summarise(), you can move beyond looking at raw data and begin to quantify patterns and relationships within it.
Key Takeaways:
- The split-apply-combine strategy is a powerful mental model for data summarization.
group_by()defines the subgroups, andsummarise()computes aggregate statistics for those groups.- Common summary functions include
mean(),median(),sd(),min(),max(), andn(). - Always use
na.rm = TRUEwhen summarizing columns that contain missing values (NA). - You can group by multiple columns to create more granular summaries.
- Be mindful of
dplyr's default behavior of leaving "leftover groups" and useungroup()or.groups = "drop"to control it.
Preview of the Next Lesson:
So far, all our operations have been on a single data frame. However, real-world analysis, especially in research, often requires combining information from multiple sources. For example, you might have one file with patient demographics and another with lab results. In our next lesson, we will learn how to merge two data frames together using dplyr's join functions, starting with the most common one: left_join().