Introduction
Welcome to the fifth module of our course, where we pivot from data manipulation to data visualization. In the previous lessons, you built a strong foundation in R's programming logic, culminating in the ability to write flexible functions with conditional statements. This skill is vital for preparing data, but the ultimate goal of much data analysis, especially in research, is to communicate findings effectively. High-quality visualizations are arguably the most powerful tool for this.
This lesson introduces the "solid foundation" for creating what you termed the "extravagant build" of publication-quality graphics. We will explore the Grammar of Graphics, the powerful theoretical framework that underlies the ggplot2 package. Instead of learning a set of rigid commands for specific plots, you will learn a systematic, component-based approach to building any plot. Specifically, we will focus on the three essential components: data, aesthetic mappings, and geometric objects (geoms). Understanding this philosophy will make learning to create complex and customized visualizations much more intuitive.
1. The Philosophy of Layered Graphics
At its core, the Grammar of Graphics proposes that a statistical graphic is a mapping of variables in your data to aesthetic properties (like position, color, or shape) of geometric objects (like points, lines, or bars).
This is analogous to how language works. We combine elements like nouns and verbs according to grammatical rules to form meaningful sentences. Similarly, ggplot2 allows us to combine layers like data, aesthetics, and geoms according to the Grammar of Graphics to build meaningful plots.
The video below from the R Programming 101 channel offers an excellent high-level introduction to this idea, focusing on the three most important components.
ggplot for plots and graphs. An introduction to data visualization using R programming
This segment from "ggplot for plots and graphs" provides a concise overview of the core philosophy behind the Grammar of Graphics.
Please watch the section that introduces the three key components: data, mapping, and geometric representation. This will set the stage for our detailed exploration.
As the video mentioned, we will focus on these three essential layers. However, it's useful to see how they fit into the complete seven-layer grammar.
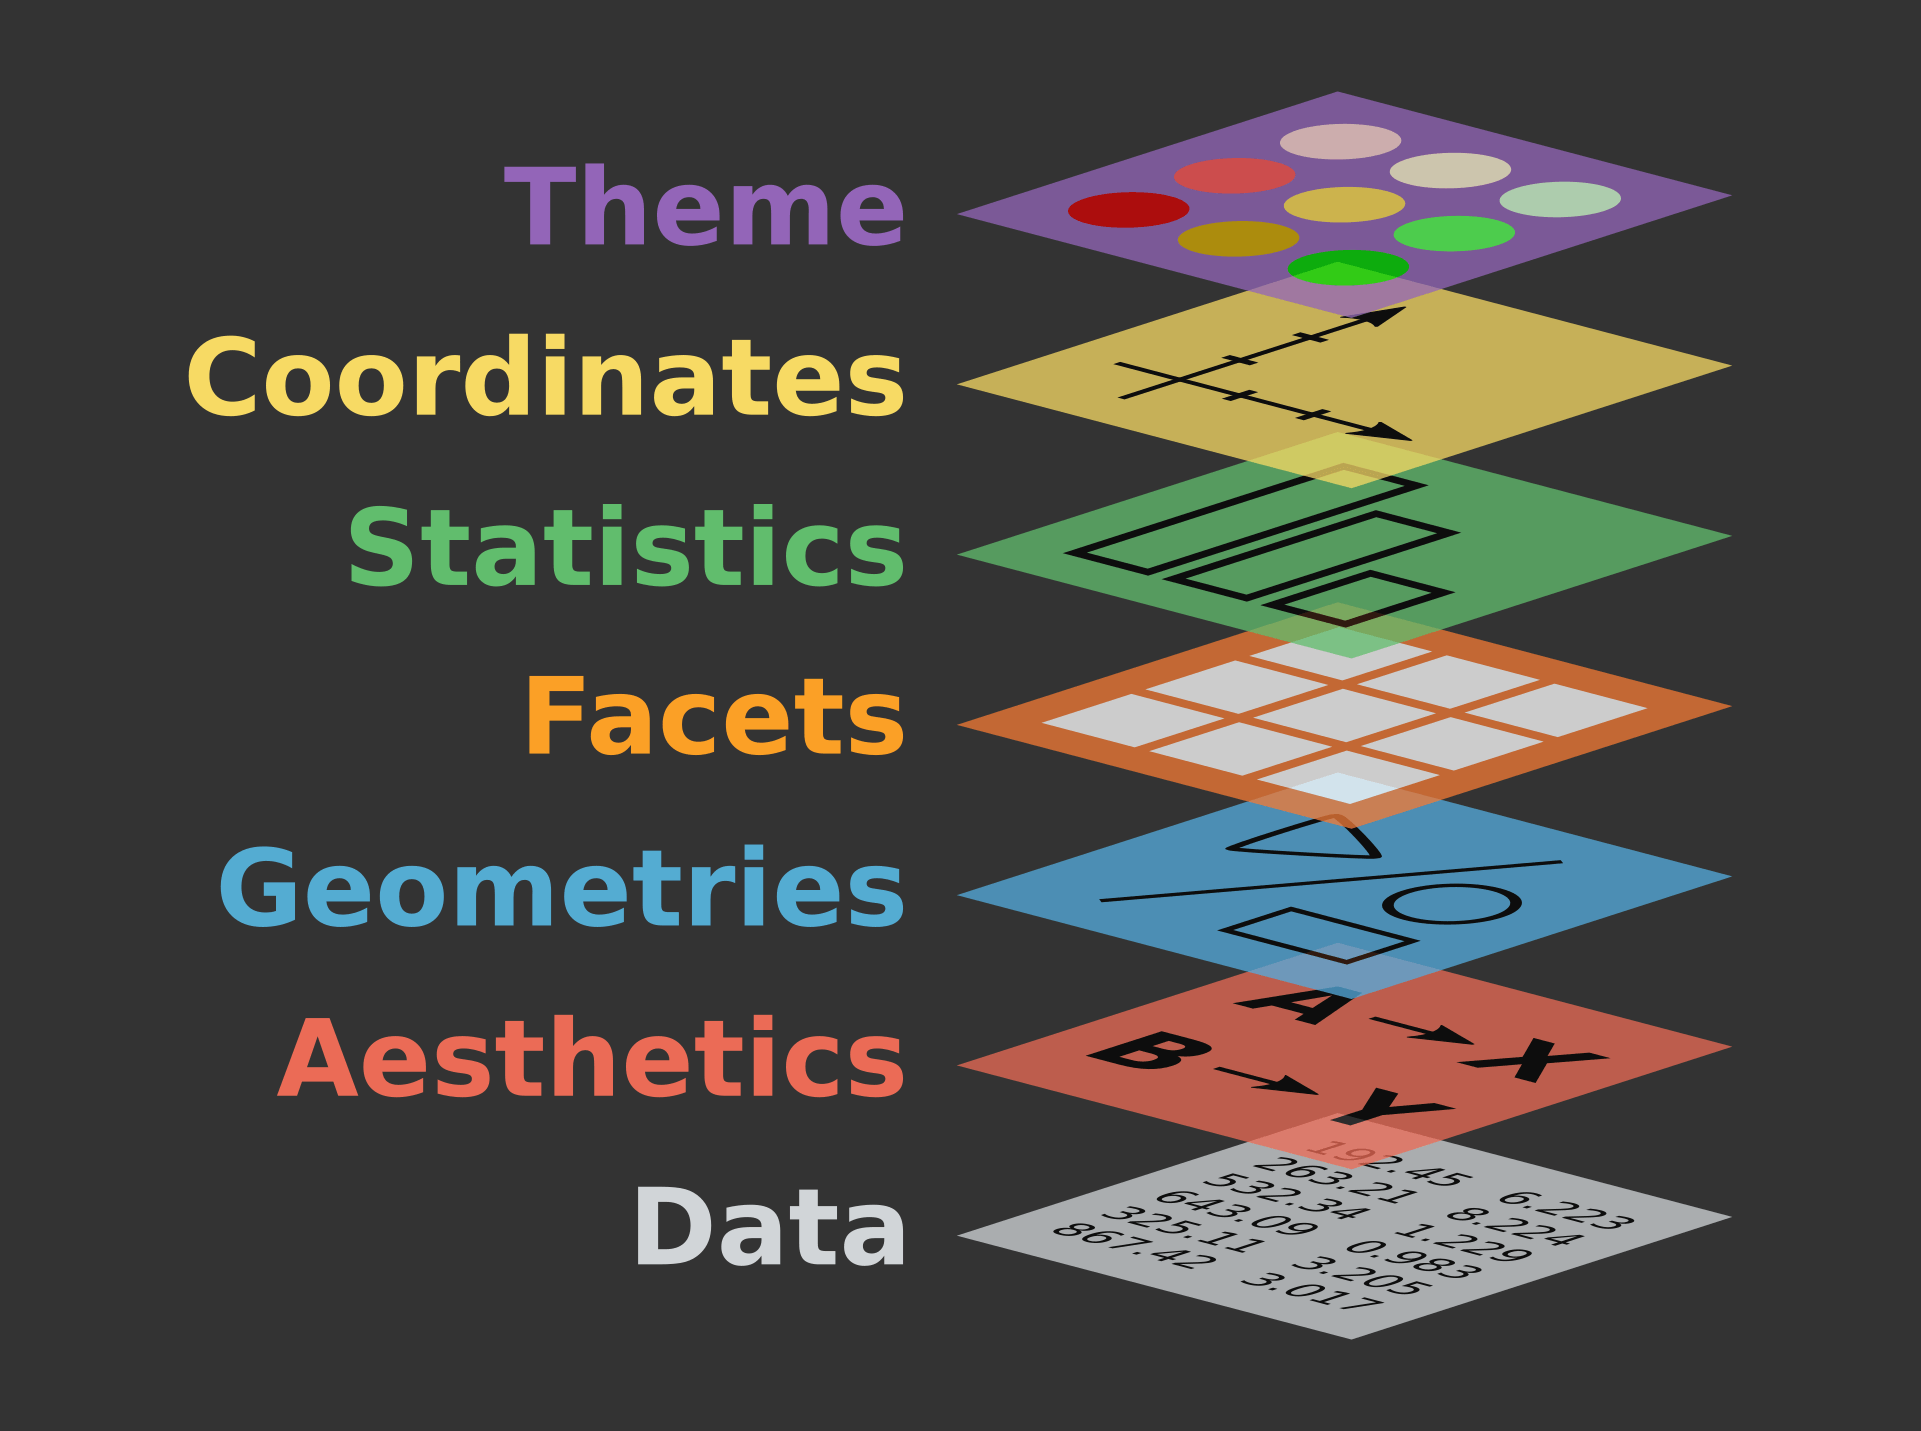
2. The Three Essential Components
To create any plot with ggplot2, you must define three key things. Let's explore each one.
17 Intro to ggplot2 - Introduction to Data Analysis with R
The "The layered Grammar of Graphics" section of this resource provides clear, formal definitions for the three essential components.
Please read the subsection The layered Grammar of Graphics. As you read, focus on internalizing the definitions of data, aesthetics, and geometries.
Let's break these down further.
a. Data
This is the most straightforward component. Every plot begins with a dataset, which in R is almost always a data frame or a tibble. This data frame contains the variables you wish to visualize.
b. Aesthetics (aes)
Aesthetics are the visual properties of the plot that can be controlled. This is where you connect, or map, the variables from your dataset to visual elements on the plot. Common aesthetics include:
xandy(the position on the axes)color(the outline of a shape)fill(the interior of a shape)size(the size of points or thickness of lines)shape(the shape of points)alpha(the transparency)
The concept of mapping is crucial. You are not telling ggplot2 to "make the points blue." You are telling it to "let the color of the points represent the species variable." ggplot2 then automatically assigns a unique color to each species and creates a legend for you.
This image provides a perfect illustration of mapping:

c. Geometries (geom)
Geometries are the geometric objects that are used to represent your data on the plot. The geom you choose determines the type of plot you create. For example:
geom_point()creates a scatter plot by drawing a point for each observation.geom_line()creates a line graph, often used for time series.geom_bar()creates a bar chart.
You can even combine multiple geoms in a single plot, for example, by overlaying a line on top of points.
3. Building a Plot, Layer by Layer
Now, let's see how these three components come together in code. The basic template for a ggplot2 call is:
ggplot(data = YOUR_DATA, mapping = aes(x = VARIABLE_1, y = VARIABLE_2)) +
  geom_FUNCTION()
Notice how the data and mapping are defined inside the main ggplot() function, and then the geom layer is added using a + sign. This additive, layered approach is what makes ggplot2 so flexible.
The following reading walks you through the process of building a plot step-by-step, showing how each layer contributes to the final graphic.
17 Intro to ggplot2 - Introduction to Data Analysis with R
This section provides a practical demonstration of building a plot from the ground up, starting with a blank canvas and adding each of the three essential layers.
Please read the entire section Working through the essential layers. Follow the code in "Building a ggplot() in steps" and observe how the plot evolves from a blank grey canvas to a complete scatter plot as each layer (data, aes, geom) is added.
4. Mapping vs. Setting Aesthetics
A common point of confusion for new ggplot2 users is the difference between mapping an aesthetic to a variable and setting it to a fixed value.
- Mapping: When you want a visual property to represent a variable from your data, you put the mapping inside the
aes()function. For example,aes(color = region)tellsggplot2to assign a different color to each unique value in theregioncolumn.ggplot2automatically creates a legend. - Setting: When you want to apply a visual property to all elements uniformly, you specify it as an argument to the
geom_*()function, outside ofaes(). For example,geom_point(color = "blue")makes all points blue. The color does not represent any data and no legend is created.
The distinction is critical for creating the exact visual you intend. The following reading clarifies this with clear examples.
17 Intro to ggplot2 - Introduction to Data Analysis with R
These sections explain how to modify plots by changing mappings and highlight the crucial difference between mapping an aesthetic and setting it to a fixed value.
First, quickly read through the examples of adding a color and fill mapping inside aes(). Next, carefully study section 17.6.4 on Fixed aesthetics. Pay close attention to the syntax difference: mappings are inside aes(), while settings are inside geom_*().
5. The Complete Grammar
While we have focused on the three essential layers, the full grammar provides a comprehensive system for describing any plot. The canonical book R for Data Science provides a concise summary of this theoretical framework. Understanding this will cement the concepts we've discussed today.
9 Layers – R for Data Science (2e)
This section from the definitive book on the tidyverse provides a formal summary of the layered grammar, putting everything you've learned into a theoretical context.
Please read section 9.8, The layered grammar of graphics. This text synthesizes how the dataset, geom, mappings, stats, position adjustments, and other components form a complete system for creating visualizations.
This systematic view is what makes ggplot2 so powerful. Once you are fluent in this grammar, you are not limited to pre-packaged plot types; you have the building blocks to invent your own visualizations to best tell the story in your data.
Conclusion
In this lesson, you have learned the "why" behind ggplot2—the Grammar of Graphics. By deconstructing plots into independent, combinable layers, this system provides an incredibly powerful and flexible foundation for data visualization. Your understanding of this framework is the first and most important step toward creating the publication-quality graphics needed for your research goals.
Key Takeaways:
- Grammar of Graphics: A theoretical framework that defines plots as a combination of independent layers.
- Three Essential Components: Every
ggplot2graphic requiresdata(a data frame),aes(mappings of variables to visual properties), and at least onegeom(the geometric objects that represent the data). - Layered Syntax: Layers are combined using the
+operator. Data and aesthetic mappings are typically defined globally inggplot(), and geoms are added as separate layers. - Mapping vs. Setting: Mappings connect aesthetics to data variables and are placed inside
aes(). Settings apply a fixed aesthetic to all objects and are placed outsideaes(), within ageomfunction.
Preview of the Next Lesson:
With this theoretical foundation in place, we will move on to the practical application. In the next lesson, you will use your knowledge of data, aesthetics, and geoms to create some of the most common and useful plot types for research: scatter plots, line plots, and bar charts.