Introduction
Over the last few lessons, you have built a comprehensive toolkit for creating visualizations with ggplot2. You've learned the Grammar of Graphics, customized plot aesthetics and themes, and mastered faceting to produce complex, multi-panel figures. You can now craft a plot that tells a clear and compelling story. But a plot inside RStudio is only half the journey. To include it in a thesis, a journal submission, or a presentation, you need to export it into a high-quality, portable file.
This lesson covers the final, crucial step in the visualization workflow: saving your plots. You will learn to use the ggsave() function to export your ggplot2 creations into various file formats like PNG, PDF, and TIFF. We will focus on the practical aspects of preparing figures for publication, such as controlling dimensions, resolution, and file type, ensuring your work meets the exacting standards of academic and professional communication.
1. From On-Screen to On-Paper: The Need for Controlled Export
When you create a plot in RStudio, what you see in the "Plots" pane is a convenient preview. If you simply resize that pane, you'll notice the plot elements—text, points, lines—reflow and resize themselves. This is great for interactive exploration, but for a final publication, you need absolute control. The figure must have a specific physical size (e.g., 88 mm for a single-column figure) and a minimum resolution (e.g., 300 DPI) to print clearly.
Most academic journals provide detailed guidelines for figure submission. Before you even start saving, it's a best practice to know the target specifications.
The following video clip shows a researcher preparing a figure for the journal mSphere. Watch how he first consults the journal's author guidelines to find the required dimensions and file formats. This is the professional workflow you should aim to emulate.
Creating publication quality figures in R with ggplot2 (CC066)
This video from the Riffomonas Project walks through the process of creating a publication-quality figure.
Watch the segment from where the presenter discusses the importance of knowing your target journal's requirements for figure width, height, and format.
2. The Modern Standard: ggsave()
While R has base functions for saving plots (e.g., opening a png() device, printing the plot, and closing it with dev.off()), the ggplot2 ecosystem provides a much more streamlined and convenient function: ggsave(). It is designed specifically to work with ggplot objects and is the recommended method.
ggsave() is powerful because it combines simplicity with fine-grained control. At its most basic, it saves the last plot you displayed. However, the best practice is to first save your plot to a variable, then pass that variable to ggsave(). This avoids any ambiguity about which plot is being saved.
Let's revisit the faceted boxplot of the ToothGrowth data from our last lesson.
library(tidyverse)


# Create the plot and save it to a variable `p`
p_tooth <- ggplot(ToothGrowth, aes(x = supp, y = len, fill = supp)) +
  geom_boxplot() +
  theme_bw() +
  theme(legend.position = "none") +
  labs(
    title = "Effect of Vitamin C on Tooth Growth in Guinea Pigs",
    x = "Supplement Type",
    y = "Tooth Length"
  ) +
  facet_wrap(~ dose)


# Display the plot
p_tooth
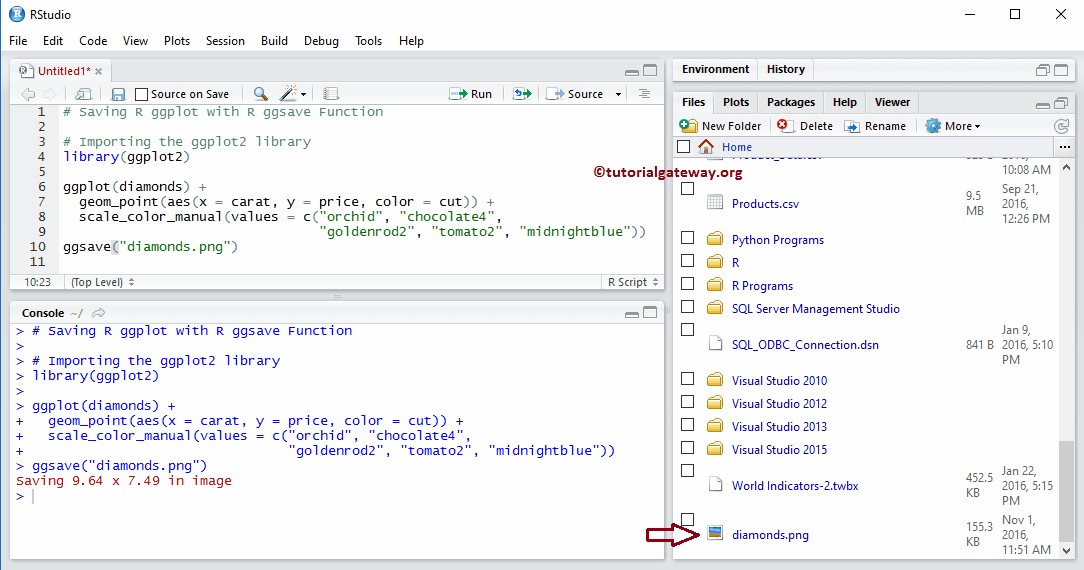
Now, to save this plot, we use ggsave().
# A simple save to a PNG file
ggsave(filename = "figures/toothgrowth_plot.png", plot = p_tooth)
Note: This command assumes you have a sub-folder named figures in your RStudio Project. It's a good habit to organize outputs this way.
3. Controlling Your Output: Key ggsave() Arguments
The real power of ggsave() lies in its arguments, which allow you to meet specific publication requirements. Let's explore the most important ones.
The article below provides an excellent overview of both the basic ggsave() function and some best practices for its use.
Plot Saving in R: Techniques and Best Practices - Tilburg Science Hub
This guide from Tilburg Science Hub clearly explains why ggsave() is the preferred method for saving ggplot2 plots.
Read the section Saving Plots with ggsave(). Pay close attention to the Syntax and Argument Overview table, which lists the key parameters you'll be using.
As you read, the essential arguments to master are:
filename: The name of the output file. The file extension you use (.png,.pdf,.tiff,.jpeg,.svg) automatically determines the output format.plot: The plot object you want to save (e.g.,p_tooth).widthandheight: The physical dimensions of the saved plot.units: The units forwidthandheight(e.g.,"in"for inches,"cm"for centimeters,"mm"for millimeters).dpi: "Dots per inch," which sets the resolution for raster formats (like PNG and TIFF). Common values are300for high-quality screen display and600or higher for print publication.
Let's save our ToothGrowth plot again, but this time as a 6x4 inch TIFF file with a resolution of 600 DPI, a common requirement for print journals.
ggsave(
  filename = "figures/toothgrowth_publication.tiff",
  plot = p_tooth,
  width = 6,
  height = 4,
  units = "in",
  dpi = 600
)
The following video demonstrates this exact process, emphasizing how these arguments give you precise control over the final output.
How to Export High Quality Image from R
This video from LiquidBrain Bioinformatics offers another practical look at exporting high-quality images.
Watch the segment from the introduction to ggsave. The presenter clearly demonstrates how to use ggsave() and its key arguments like width, height, units, and dpi.
4. Vector vs. Raster: Choosing the Right Format
The file extension in filename is not just a label; it tells ggsave() what kind of file to create. There are two main families of image formats:
-
Vector Formats (
.pdf,.svg): These formats store images as a set of mathematical instructions (e.g., "draw a line from point A to point B"). Their key advantage is infinite scalability. You can zoom in on a PDF or SVG as much as you want, and the lines and text will remain perfectly sharp. This makes them ideal for plots containing text and geometric shapes. Many journals prefer or require PDF figures. -
Raster Formats (
.png,.jpeg,.tiff): These formats store images as a grid of colored pixels. They are excellent for complex images like photographs. However, if you enlarge a raster image too much, it will become blurry or "pixelated." Thedpiargument is only relevant for these formats, as it determines the density of pixels in the grid.
For most plots you create with ggplot2, a vector format like PDF is an excellent choice because it guarantees high quality at any size. You would typically use a raster format like TIFF if a journal specifically requires it or if your plot contains thousands of semi-transparent data points, where a PDF could become a very large and slow-to-render file.
5. Best Practices for a Reproducible Workflow
Saving plots is part of your overall analysis workflow. Adopting good habits here will make your research more organized and reproducible.
-
Organize Your Files: As mentioned, create a
figuresoroutputssub-directory within your RStudio Project. Save all your plots there. This keeps your project tidy. If you are using theherepackage, you can construct a robust path like this:here::here("figures", "my_plot.png"). -
Use Descriptive Filenames: Name your files clearly.
figure1_scatterplot_bp_vs_weight.pdfis much more informative thanplot.pdf. Thesnake_casenaming convention (all lowercase, with words separated by underscores) is a common and recommended standard in the R community.
The Tilburg Science Hub article you looked at earlier contains excellent advice on this.
Plot Saving in R: Techniques and Best Practices - Tilburg Science Hub
This article also covers workflow best practices.
Now, read the section Expanding ggsave() Functionality. Focus on the principles for file naming and directory structure. The part about time-stamping is an advanced technique you can keep in mind for later.
Conclusion
You have now completed the entire visualization pipeline, from raw data to a publication-ready figure file. With ggsave(), you have the power to export your carefully crafted ggplot2 plots with the precise specifications needed for any medium, be it a journal article, a poster, or a slide presentation.
Key Takeaways:
- Always check the figure submission guidelines of your target publication for requirements on file format, dimensions (
width,height), and resolution (dpi). ggsave()is the standard function for savingggplot2plots. Best practice is to save your plot to a variable first.- Use the
width,height,units, anddpiarguments inggsave()to gain precise control over the output. - Choose the right file format for the job. Vector formats like PDF (
.pdf) are generally preferred for their scalability and sharp rendering of lines and text. - Maintain an organized project by saving plots to a dedicated
figuresdirectory and using descriptive, consistent filenames.
Preview of the Next Lesson:
Saving plots as individual files is essential, but often you need to integrate them into a larger document that includes your narrative, code, and tables. In the next module, we will dive into R Markdown. You will learn how to weave your text, R code, and ggplot2 visualizations together into a single, cohesive, and fully reproducible report that can be exported as HTML, PDF, or Word documents. This will be a major step towards producing complete data analysis projects.