Hello. This module turns from how auroras form to what a forecast can—and cannot—tell you about seeing one. In this lesson, you will read two kinds of information: the planetary Kp index and a modeled auroral-oval map. The aim is to make a defensible statement about auroral potential without mistaking it for a promise about your view of the sky. Allow about 35–40 minutes, including the short video, readings, and time to inspect the map.
What a Kp number measures
Kp describes geomagnetic activity: disturbance of Earth’s magnetic field on a planetary scale. Its scale runs from 0 to 9. Higher Kp generally accompanies an auroral oval that extends farther from the magnetic poles and more widespread or intense activity. That makes Kp useful for judging whether an aurora might become accessible at lower magnetic latitudes than usual.
An observed Kp value summarizes a preceding three-hour interval. A forecast Kp is a prediction of a future interval, not a measurement already made. Neither version tells you whether an aurora is above a particular town at a particular minute. Watch this brief distinction before turning to the map.
Forecasting the Northern Lights! 2: Kp Index,NOAA Satellites,Coronal Mass Ejections & Coronal Holes
Watch “Forecasting the Northern Lights! 2” from science out there for its explanation of what a Kp boundary means to an observer and why an observed Kp is not itself a forecast.
Watch Kp and distance for the distinction between being beneath an auroral display and seeing one toward the horizon. Then watch past activity for the three-hour, retrospective meaning of an observed Kp value. Focus on the qualifications, not on treating a mapped boundary as a sharp visibility line.
NOAA’s viewing guidance supplies the next qualification: Kp’s relationship to the oval is approximate, and latitude in that relationship is magnetic latitude, not geographic latitude. The two differ because Earth’s magnetic and geographic poles do not coincide. Consequently, a single geographic latitude on a conventional map is not a universal “Kp threshold” for seeing aurora.
Tips on Viewing the Aurora | NOAA / NWS Space Weather Prediction Center
Read NOAA’s “Tips on Viewing the Aurora” to connect Kp with the oval’s approximate position, then separate that position from actual viewing conditions.
Under “Tips on Viewing Aurora,” read factor 1, “Geomagnetic Activity,” from the Kp guidance. Continue through the paragraph beginning “There is an approximate relationship between Kp” and factor 2, “Location,” in latitude and location. Finally, read factors 3, “It must be dark,” and 4, “Timing,” from the city-lights advice through the timing advice. Notice which claims are averages and which concern the observer rather than geomagnetic activity.
For orientation, NOAA gives a rough equatorward edge of about magnetic latitude at Kp 0, moving about equatorward per Kp level. That would put the rough edge near magnetic latitude at Kp 5. This is a guide to the oval’s broad extent, not a boundary at which visibility switches on. The oval varies around Earth; an elevated display can be seen from outside its mapped footprint if it is bright enough and the view toward it is unobstructed. Conversely, standing at a latitude the oval reaches does not ensure that it is dark, clear, or bright enough to see anything.
You may also encounter NOAA’s G-scale alongside Kp. A label of “G1” at Kp 5 denotes a minor geomagnetic storm classification. It describes geomagnetic conditions, not a rating of how impressive a photograph—or a naked-eye view—will be.
Reading a modeled auroral oval
Now examine this illustrative Kp 5 map. It is a polar view of the Northern Hemisphere: the region near the pole lies toward the middle, while lower latitudes lie farther out. The colored band is an oval around the magnetic polar region, not a disk covering everything inside it. That shape matters: a location near the center of the projection is not automatically in the strongest modeled aurora.
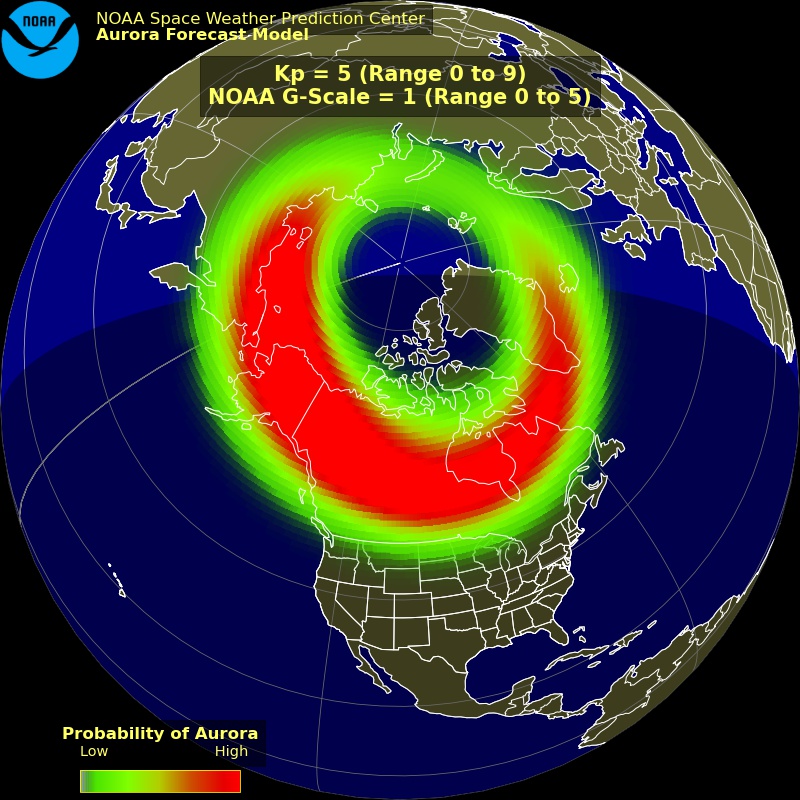
Read the map in three passes. First, identify what is being mapped. “Kp = 5” is the activity level represented by this illustration; “G-Scale = 1” is its geomagnetic-storm classification. Neither label is a local viewing prediction. Next, use the map’s own legend: on this image, red indicates higher modeled probability of aurora than green. The red, orange, and green are map colors, not a prediction that the sky will glow in those colors. Finally, locate a place relative to the band. Being beneath or near the band suggests greater auroral potential than being far from it, but the position of the band is modeled, not an observed outline of light at ground level.
There are two ways to misread that last pass. One is to see your location outside the band and conclude “impossible”: a tall, bright aurora farther poleward may still appear low on your horizon. The other is to see your location beneath a red area and conclude “guaranteed”: even where aurora is occurring aloft, daylight or cloud can prevent a view. A probability legend for aurora in the model is not a percentage chance that you will see aurora from a particular spot. The map has not incorporated your unobstructed horizon, local cloud cover, or nearby lighting into that personal claim.
The static illustration also lacks the timing needed for a current observing decision. In a live forecast, you would check when the map is valid, not just whether a colored band passes near a location. Auroral activity changes, and Earth rotates beneath the region being mapped. A promising area at one time does not fix the view several hours later.
A short-term oval map is not just “Kp drawn on a globe”
A Kp-based illustration is helpful for learning the broad relationship between geomagnetic activity and oval extent. NOAA also provides a short-term aurora forecast based on a model called OVATION. It normally uses measurements of the solar wind and its magnetic field taken upstream of Earth to estimate the oval’s location and intensity over a roughly 30-to-90-minute forecast window. Thus, two products can both show an auroral oval while answering somewhat different questions: What might an oval look like at Kp 5? versus Where does a short-term model place activity for its stated forecast time?
Aurora - 30 Minute Forecast | NOAA / NWS Space Weather Prediction Center
Read NOAA’s “Aurora - 30 Minute Forecast” to see how a time-specific modeled oval differs from the illustrative Kp 5 map, and what its colors and lead time mean.
Below the product title and its “Usage,” “Impacts,” and “Details” navigation, begin with the forecast description. In the map explanation, read from “The two maps show the North and South poles” through the viewing caveat. In “Details,” after the links about aurora and its impacts, find the paragraph about OVATION’s inputs; read from model inputs and fallback. Focus especially on the distinction between the usual upstream-data forecast and the occasional Kp-based estimate with no forecast lead time.
Be attentive to each product’s legend. NOAA describes its short-term product’s green-to-red oval in terms of forecast auroral intensity, whereas the Kp 5 image supplied here explicitly labels its green-to-red scale “Probability of Aurora.” You should not silently substitute one legend for the other—or read either as the visible color of the sky. NOAA explains that an estimate of viewing probability can be derived from modeled intensity, but that estimate still does not account for every local obstacle to seeing it.
The lead time matters too. When the short-term model has suitable upstream solar-wind data, it can offer a limited look ahead while that measured wind travels toward Earth. NOAA notes that when those inputs are unavailable and the model instead uses a current Kp-based estimate, there is no forecast lead time. A familiar-looking colored oval therefore need not carry the same predictive meaning on every occasion.
From map statement to viewing statement
A careful interpretation keeps three claims distinct:
- Geomagnetic claim: “Kp is 5,” or “Kp 5 is forecast for this interval.” This concerns planetary magnetic activity.
- Auroral claim: “For the stated time, this model places a stronger or more likely auroral region here.” This concerns an estimated pattern above Earth.
- Viewing claim: “An observer here may be able to see it.” This additionally depends on darkness, the direction and openness of the view, clouds, and competing light.
Only the third claim is about an actual sighting. Imagine that a map places strong modeled activity over an area in daylight, while a darker location sits just outside the band with a clear view toward it. The first area has stronger mapped auroral potential, but the second might have the better immediate viewing opportunity. Neither outcome can be settled by Kp alone.
This is why a high Kp should prompt attention rather than certainty, and a modest Kp should not automatically dismiss a well-placed observer beneath or within sight of the oval. The sound forecast language is conditional: “Activity may extend far enough to make aurora possible here if it is dark and viewing conditions cooperate.” It communicates what the geomagnetic information supports without promising photons will reach your eyes through a clear, dark sky.
Takeaways
Kp is a planetary, three-hour measure of geomagnetic disturbance; a forecast Kp predicts that measure for a future period. Higher values generally favor a broader auroral oval, but the relationship is approximate and uses magnetic latitude. A modeled oval adds spatial detail for its stated conditions and time; its colors mean what that map’s legend says, not necessarily the colors of auroral light. Neither Kp nor a red patch is a guarantee of local visibility.
Next, you will examine why forecasts become less certain farther ahead—especially when the arrival time and magnetic orientation of solar-wind disturbances are not yet known precisely.