Introduction
Welcome back! In our last lesson, you learned the essential first step of any Tableau project: connecting to your data files. You now know how to bring Excel and CSV files into the Tableau environment and check that the data has loaded correctly.
Today, we'll address the next crucial decision you'll make on that very same Data Source page. This lesson focuses on the learning outcome: Distinguish between live connections and data extracts, and choose the appropriate type for a given scenario.
When you connect to data, Tableau gives you two options for how to access it: a live connection or a data extract. Understanding the difference between these is fundamental to controlling your workbook's performance, ensuring your data is up-to-date, and even determining whether you can work offline. We'll cover the "what," the "why," and the "when" for each connection type, empowering you to make the right choice for your analysis.
The Core Concept: Live vs. Extract
At a high level, the choice is simple and can be understood with an analogy. A live connection is like streaming a movie: you need an active internet connection to the source, and you're always getting the most current version. A data extract is like downloading that movie: you create a local copy that you can watch anytime, anywhere, even offline, but it won't include any new scenes added after you downloaded it.
This diagram visually represents the two different data flows:
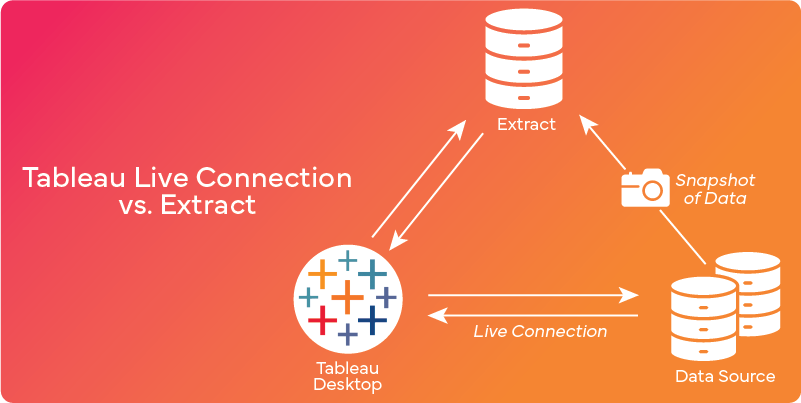
Now, let's watch a short video that explains this core trade-off between performance and data freshness.
Tableau Live vs Extract | #Tableau Course #19
This video from Data with Baraa provides a clear and concise explanation of how live connections and extracts work, and introduces the key decision-making factor: performance versus data freshness.
Watch from 00:28 to 02:20. As you watch, focus on understanding: How a live connection sends queries directly to the source database. How an extract uses a local copy stored inside Tableau. The central trade-off between dashboard speed and having the very latest data.
To summarize:
-
Live Connection:
- How it works: Tableau sends queries directly to your original data source (e.g., your Excel file or a corporate database).
- Pro: The data is always up-to-date. Any changes in the source data are reflected in your dashboard (after a refresh).
- Con: Performance depends entirely on the speed of the source data system. Large datasets or slow databases can result in slow dashboards.
-
Data Extract (.hyper file):
- How it works: Tableau takes a snapshot of the data and saves it as a highly compressed and optimized file (with a
.hyperextension) on your computer. Your workbook then queries this local file. - Pro: Performance is typically much faster, as the data is optimized for Tableau. You can also work on your data offline.
- Con: The data is static. It is only as fresh as the last time you created or refreshed the extract.
- How it works: Tableau takes a snapshot of the data and saves it as a highly compressed and optimized file (with a
A Practical Demonstration
Now that you understand the theory, let's see how this works in practice. We'll use a video that demonstrates the process using an Excel file, building directly on what you learned in the previous lesson.
The video will show you:
- How a live connection reflects changes made to the source Excel file.
- How to switch to an extract.
- How an extract does not automatically reflect changes and must be manually refreshed.
- The visual icons in Tableau that tell you which connection type is active.
This hands-on demonstration from TutorialsPoint walks you through using both connection types with an Excel file.
Watch from 01:11 to 06:01. Pay close attention to the following steps: (01:11 - 04:11) The presenter uses a live connection. Notice how after adding a new row to the Excel file and saving it, right-clicking the data source in Tableau and selecting 'Refresh' immediately brings in the new data. (04:11 - 05:26) The presenter switches to an extract. When a new row is added to the Excel file this time, a simple 'Refresh' does nothing. The extract must be explicitly refreshed by right-clicking the data source and choosing Extract > Refresh. (05:26 - 06:01) Note the visual difference in the Data Pane: a single cylinder icon for a live connection, and a double-cylinder icon for an extract.
This hands-on view is crucial. The simple act of switching between the 'Live' and 'Extract' radio buttons on the Data Source page fundamentally changes how your workbook interacts with its data.
When to Choose Live vs. Extract
You now know the "what" and the "how." The final piece is the "when"—choosing the right connection for a given scenario. This decision is a strategic one that you'll make in your future role as an analyst.
Here is a summary to guide your decision-making:
| Use a Live Connection when... | Use a Data Extract when... |
|---|---|
| Data freshness is critical. You are monitoring real-time operational data (e.g., factory output, website traffic, stock prices). | Performance is critical. Your dashboard is slow due to a large or complex data source. |
| The source database is very fast and optimized for analytics. | You need to work offline or share the workbook with someone who doesn't have access to the source data. |
| The dataset is relatively small, so performance is not a concern. | The source data is static or only updates periodically (e.g., daily, weekly, monthly). |
| You need to enforce row-level security based on the user's database credentials. | You want to reduce the load on a critical database. |
To deepen your understanding of these use cases, let's look at a more detailed article.
Tableau Live vs Extract: Which Data Connection Actually Makes ...
This article from darwinapps.com provides excellent real-world scenarios that will help you think like an analyst when choosing a connection type.
Read the sections 'Live Connection Tableau: Real-Time Access Explained' and 'Tableau Extracts: Speed and Portability Benefits'. Focus on the 'Use cases for always-fresh dashboards' and 'Offline access and sharing' subsections to solidify your understanding of practical scenarios.
As someone planning to use Tableau Public, you will primarily use data extracts. When you upload a file (like a CSV or Excel file) to Tableau Public, it is essentially creating an extract that is stored on the Tableau server. This is one reason why Tableau Public is so fast and performant. Live connections are more common in enterprise environments with direct connections to company databases.
Your Turn: Hands-On Practice
Let's apply what you've learned.
- Open Tableau.
- Connect to the Sample - Superstore Excel file, which you can find in your
My Tableau Repository/Datasourcesfolder. - On the Data Source page, ensure the Live connection option is selected in the top-right corner.
- Go to any worksheet by clicking the "Sheet 1" tab at the bottom.
- In the Data pane on the left, notice the icon next to your "Sample - Superstore" data source. It should be a single gray cylinder.
- Now, go back to the Data Source tab at the bottom.
- Change the connection type to Extract.
- Go back to "Sheet 1". Tableau will prompt you to save the extract file. Name it
Superstore_Extractand save it. - Look at the icon next to the data source in the Data pane again. It should now be a double cylinder with an arrow, indicating it's an extract.
This simple exercise helps you practice switching between connection types and reinforces the visual cues within Tableau.
Conclusion
Excellent work! You've mastered a fundamental concept that separates beginner and intermediate Tableau users. Making a deliberate choice between a live connection and a data extract is key to building effective and efficient dashboards.
Key Takeaways:
- Live Connection: Offers real-time data but can be slow. Your dashboard's performance is tied to the source database.
- Data Extract: Offers fast performance and offline access by using a local, optimized snapshot of the data. The data is static until you refresh the extract.
- The Choice is a Trade-off: You must balance the need for data freshness against the need for performance and portability.
- Visual Cue: A single cylinder icon means 'Live', while a double-cylinder icon means 'Extract'.
Preview of the Next Lesson:
Now that your data is connected and your connection type is set, the next step is to understand the building blocks of your dataset. In our next lesson, you will learn to differentiate between dimensions and measures. This is the foundation for turning your raw data into meaningful visualizations.