Introduction
Welcome to our fourth lesson! In our previous session, you learned how to choose between a live connection and a data extract, a critical decision that impacts your workbook's performance and data freshness. You now understand the trade-offs and how to switch between these connection types.
Today, we'll dive into the data itself. Once connected, Tableau automatically categorizes your data fields into two fundamental types. This lesson addresses the learning outcome: Differentiate between dimensions and measures and explain their roles in creating visualizations.
Understanding this distinction is arguably the single most important concept for mastering Tableau. It's the foundation for how Tableau builds charts and why it behaves the way it does. We will explore:
- What dimensions and measures are.
- How to identify them in your dataset and in the Tableau interface.
- Their distinct roles in bringing your data to life as a visualization.
This knowledge will move you from simply dragging and dropping fields to intentionally constructing meaningful and accurate analyses.
The Core Distinction: Categories vs. Numbers
The simplest way to think about dimensions and measures is to relate them to the type of data they represent.
-
Dimensions are fields that contain qualitative, or categorical, data. Think of them as the "what," "who," "where," and "when" in your dataset. They provide context and are used to group, segment, or slice your data. Examples include Customer Name, Product Category, Region, and Order Date.
-
Measures are fields that contain quantitative, or numeric, data that you can perform mathematical operations on. Think of them as the values you want to measure, count, or aggregate. Examples include Sales, Profit, and Quantity.
This image provides a clear conceptual map:

A great way to remember this is through a simple analogy.
Dimensions vs Measures in Tableau
This short article from Deepak Holla provides a very clear and memorable way to think about dimensions and measures. Please read the first few paragraphs to grasp the core concept.
Read the section from the beginning down to (and including) the 'Quick tip'. Focus on the central idea: 'Dimensions divide. Measures calculate.'
This fundamental idea—that dimensions slice your data and measures provide the numbers for those slices—is the key to everything you will do in Tableau.
How Tableau Identifies Dimensions and Measures
When you connect to a data source, Tableau scans each field and makes an educated guess about whether it's a dimension or a measure. It's usually right, but sometimes you'll need to make adjustments.
So, how can you decide for yourself? The following video provides a practical decision-making process and applies it to several examples.
Tableau Dimensions and Measures EXPLAINED | #Tableau Course #46
The first part of this video from Data with Baraa explains the concept and then provides a clear, flowchart-like method for classifying any field.
Watch from the beginning to 06:54. As you watch, pay close attention to: The Definitions (00:00 - 02:52): Understand the qualitative nature of dimensions and the quantitative, aggregatable nature of measures. The Decision Process (02:52 - 03:31): Focus on the two key questions: 'Is it a number?' and 'Does it make sense to aggregate it?' The Practice Examples (03:31 - 06:54): Try to classify the fields for the 'Customers', 'Orders', and 'Products' tables yourself before the video reveals the answers. Notice why numeric fields like Customer ID and Postcode are dimensions—because summing or averaging them is meaningless.
This process is invaluable. A field like Customer ID is numeric, but since it serves as a unique identifier, it functions as a dimension (a category) rather than a measure. Always ask: "Does it make analytical sense to sum or average this number?"
Finding and Using Dimensions and Measures in Tableau
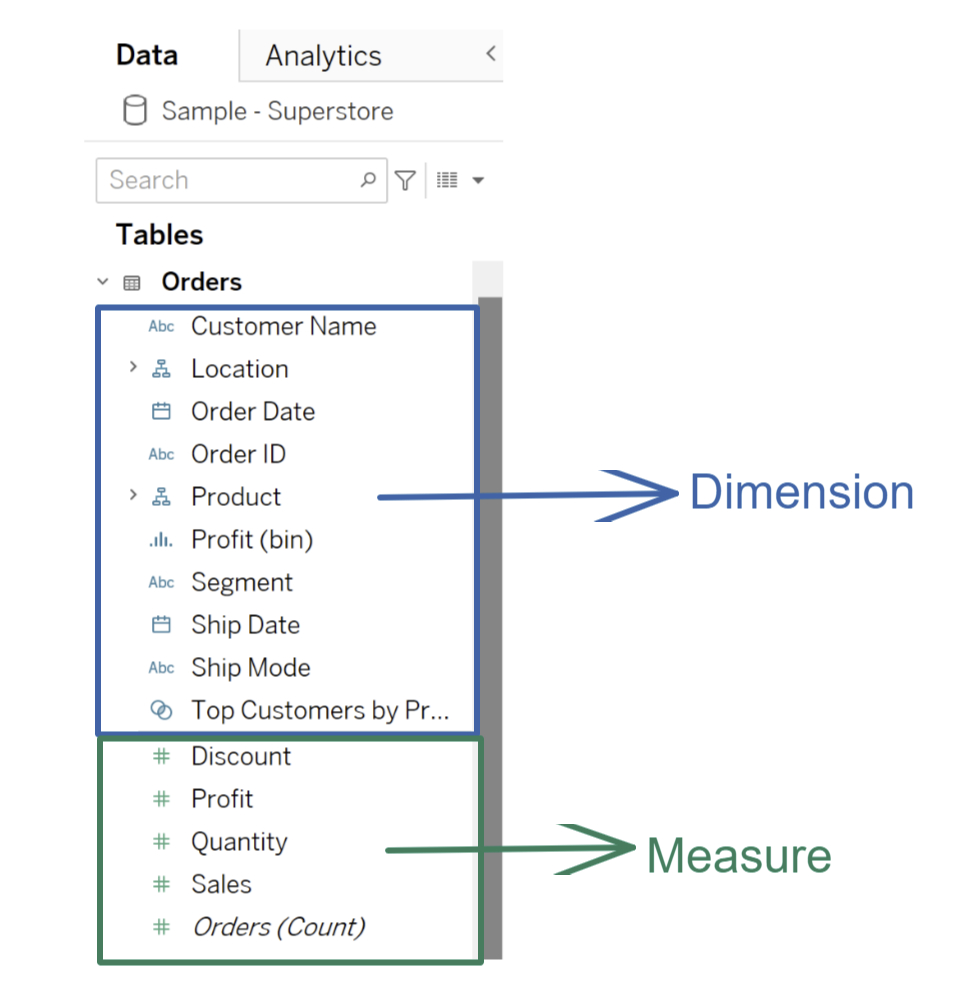
In a Tableau worksheet, you'll find all your data fields listed in the Data pane on the left. Tableau visually separates them for you.
- Fields listed above the thin gray line are Dimensions.
- Fields listed below the thin gray line are Measures.
A Common Point of Confusion: Blue vs. Green Pills
You will notice that when you drag fields into your view, they appear as colored "pills." Dimensions are often blue, and measures are often green. This leads many beginners to believe that Blue = Dimension and Green = Measure. This is incorrect and a crucial point to understand early.
The color of the pill actually represents something else:
- Blue Pills are Discrete. They represent individual, separate values (like headers or labels).
- Green Pills are Continuous. They represent an unbroken range of values (like an axis on a chart).
While dimensions usually default to discrete (blue) and measures to continuous (green), this is not a fixed rule. You can have continuous dimensions (like a time axis) and discrete measures (like a list of sales values).
Tableau Tutorial - Dimensions vs Measures, Blue vs Green, Discrete vs Continuous | sqlbelle
This short clip from sqlbelle directly addresses and clarifies the common confusion between Dimension/Measure and Blue/Green.
Watch from 03:37 to 04:52. The key takeaway is that a field's role (Dimension/Measure) is about what the data is, while its color (Blue/Green) is about how you want to display it.
For now, just remember: the location in the Data Pane (above or below the line) tells you if it's a dimension or a measure. The color tells you if it's being treated as discrete or continuous.
The Role in Creating Visualizations: Slicing the Data
Now for the most important part: what happens when you combine dimensions and measures?
- When you use a measure by itself, Tableau performs an aggregation (like SUM or AVG) on the entire dataset. For example, dragging
Salesto your view will give you one number: the total sales. - When you add a dimension, you give Tableau instructions on how to slice that measure. Each unique value in the dimension creates a separate "mark" or slice.
Let's see this in action.
Tableau Dimensions and Measures EXPLAINED | #Tableau Course #46
This final clip from the Data with Baraa video beautifully demonstrates how dimensions define the level of detail in a view by splitting up a measure.
Watch from 10:50 to 13:16. Notice how starting with a single measure (SUM(Sales)) gives one total value. Each time a dimension (Category, Product Name, Order ID) is added, the view is split into more and more detail. This is the core mechanic of building visualizations in Tableau.
This interaction is the engine of Tableau. You start with a question, which is framed by dimensions, and you get an answer, which is provided by measures. For example:
- Question: What are our Sales by Product Category?
- Dimension:
Product Category(the "by") - Measure:
Sales(the "what")
Hands-On Practice
Let's put this theory into practice.
- Open Tableau Desktop and connect to the Sample - Superstore dataset.
- Go to a new worksheet.
- In the Data pane, find the Sales measure (below the gray line). Drag it onto the Rows shelf. You should see a single bar representing the total sales.
- Now, find the Category dimension (above the gray line). Drag it onto the Columns shelf.
- Observe what happens: the single bar is instantly split into three bars, one for each category. You have just used a dimension to slice a measure!
- Finally, practice converting a field. Find the Order ID dimension in the Data pane. Right-click on it and select Convert to Measure. Notice it moves below the gray line. Right-click it again and select Convert to Dimension to change it back. This shows you have full control over how Tableau treats your fields.
Conclusion
Congratulations! You've just learned the most fundamental concept in Tableau. Understanding the roles of dimensions and measures is the key to unlocking its full analytical power.
Key Takeaways:
- Dimensions are qualitative, categorical fields that slice and group your data. They define the level of detail in your view.
- Measures are quantitative, numeric fields that are aggregated (summed, averaged, etc.) to provide values for those groups.
- In the Data Pane, dimensions are above the gray line, and measures are below it. This is the definitive way to identify them.
- The common blue/green pill confusion is about Discrete vs. Continuous data types, not Dimension vs. Measure.
- The basic formula for a visualization is using a dimension to define a question ("by what?") and a measure to provide the answer ("how much?").
Preview of the Next Lesson:
You've now seen a preview of how to build a basic chart. In our next lesson, we will formalize this process as we learn how to create a basic worksheet by dragging fields onto shelves. You'll get comfortable with the Rows, Columns, and Marks cards, which are the main components for building any visualization in Tableau.