Hello! In our last lesson, we contrasted TCP and UDP, understanding the fundamental trade-off between reliability and speed at the transport layer. We now know how our data is packaged for its journey. But what path does that data actually take across the internet? How does a request from your machine find its way to a server halfway across the world and back?
Today, we'll move from the transport layer (Layer 4) down to the network layer (Layer 3) to answer that question. We will get hands-on with two of the most fundamental network diagnostic tools: ping and traceroute.
Today's Goal: By the end of this lesson, you will be able to use ping and traceroute to trace a packet's path, understand the mechanisms that make these tools work, and interpret their output to diagnose basic network issues.
This is our first step in truly visualizing the network infrastructure that underpins every backend service.
1. ping: Is Anybody Out There?
Before you try to map a complex route, the first question is often the simplest: "Can I even reach the destination?" This is the job of the ping command.
ping works using the Internet Control Message Protocol (ICMP), which we've mentioned before. Specifically, it sends an ICMP message of Type 8 (Echo Request) to a destination IP address. If the destination is reachable and configured to respond, it will send back an ICMP message of Type 0 (Echo Reply).
The output tells you two main things:
- Reachability: Did you get a reply?
- Latency: How long did it take for the round trip? This is the
time=value in the output.
However, a "deep dive" requires understanding what happens when it doesn't work. The error message you receive is a crucial clue.
ICMP, Ping, and Traceroute - What I Wish I Was Taught
The article 'ICMP, Ping, and Traceroute - What I Wish I Was Taught' provides an excellent explanation of what different ping responses mean at a network level.
Read the first two sections, 'ICMP and Ping' and 'Know what ICMP messages mean'. Pay close attention to the distinction between 'Destination host unreachable' and 'Request timed out', and how the Address Resolution Protocol (ARP) plays a role on a local network.
As the article explains, the error messages are not interchangeable:
Request timed out: Your machine sent the packet, but no reply came back within the timeout period. This could mean the destination is down, a firewall is silently dropping the packet, or there's heavy network congestion. Your machine believed it had a path to the destination.Destination host unreachable: This is often more informative. A router along the path is explicitly telling you that it has no route to the destination network. The response often comes from your own default gateway, telling you the problem is immediate—it doesn't even know where to begin sending your packet.
Hands-On Practice: ping
Open your terminal (Command Prompt on Windows, or Terminal on macOS/Linux) and try these commands:
-
Ping a reliable public server:
ping 8.8.8.8This is Google's public DNS server. You should see successful replies with low latency. Press
Ctrl+Cto stop. -
Ping a non-existent address on your local network:
Try pinging an IP address on your local network that you know is not in use (e.g., if your IP is192.168.1.10, tryping 192.168.1.250).- You will likely see
Destination host unreachableif your machine fails to get an ARP reply for that IP. - Or you might see
Request timed outif your machine has a stale ARP entry and sends the packet anyway.
- You will likely see
2. traceroute: Mapping the Journey Hop by Hop
While ping tells you if you can reach a destination, traceroute shows you the path your packets take to get there. It reveals the sequence of routers (called hops) that forward your data.
This is an incredibly powerful tool for diagnosing where a network problem lies. Is the issue with your local network, your ISP, or the destination server's network? traceroute helps you pinpoint it.
How traceroute Works: A Clever Use of TTL
traceroute's mechanism is a brilliant piece of network engineering. It relies on a field in the IP header called Time To Live (TTL).
- The TTL is an 8-bit integer (a value from 0-255).
- When a packet is created, the OS sets an initial TTL value (e.g., 64).
- Every router that forwards the packet decrements the TTL by 1.
- If a router receives a packet with a TTL of 1, it decrements it to 0, discards the packet, and sends an ICMP "Time to live exceeded" (Type 11) message back to the original sender.
traceroute exploits this behavior:
- It sends a packet towards the final destination but sets the TTL to 1. The first router decrements it to 0, drops it, and sends back an ICMP error.
tracerouterecords the IP of this first router. - It sends another packet, this time with TTL = 2. It passes the first router (which decrements TTL to 1), but is dropped by the second router, which sends back an ICMP error.
tracerouterecords the IP of this second router. - This process continues, incrementing the TTL by 1 each time, until the packet finally reaches the destination.
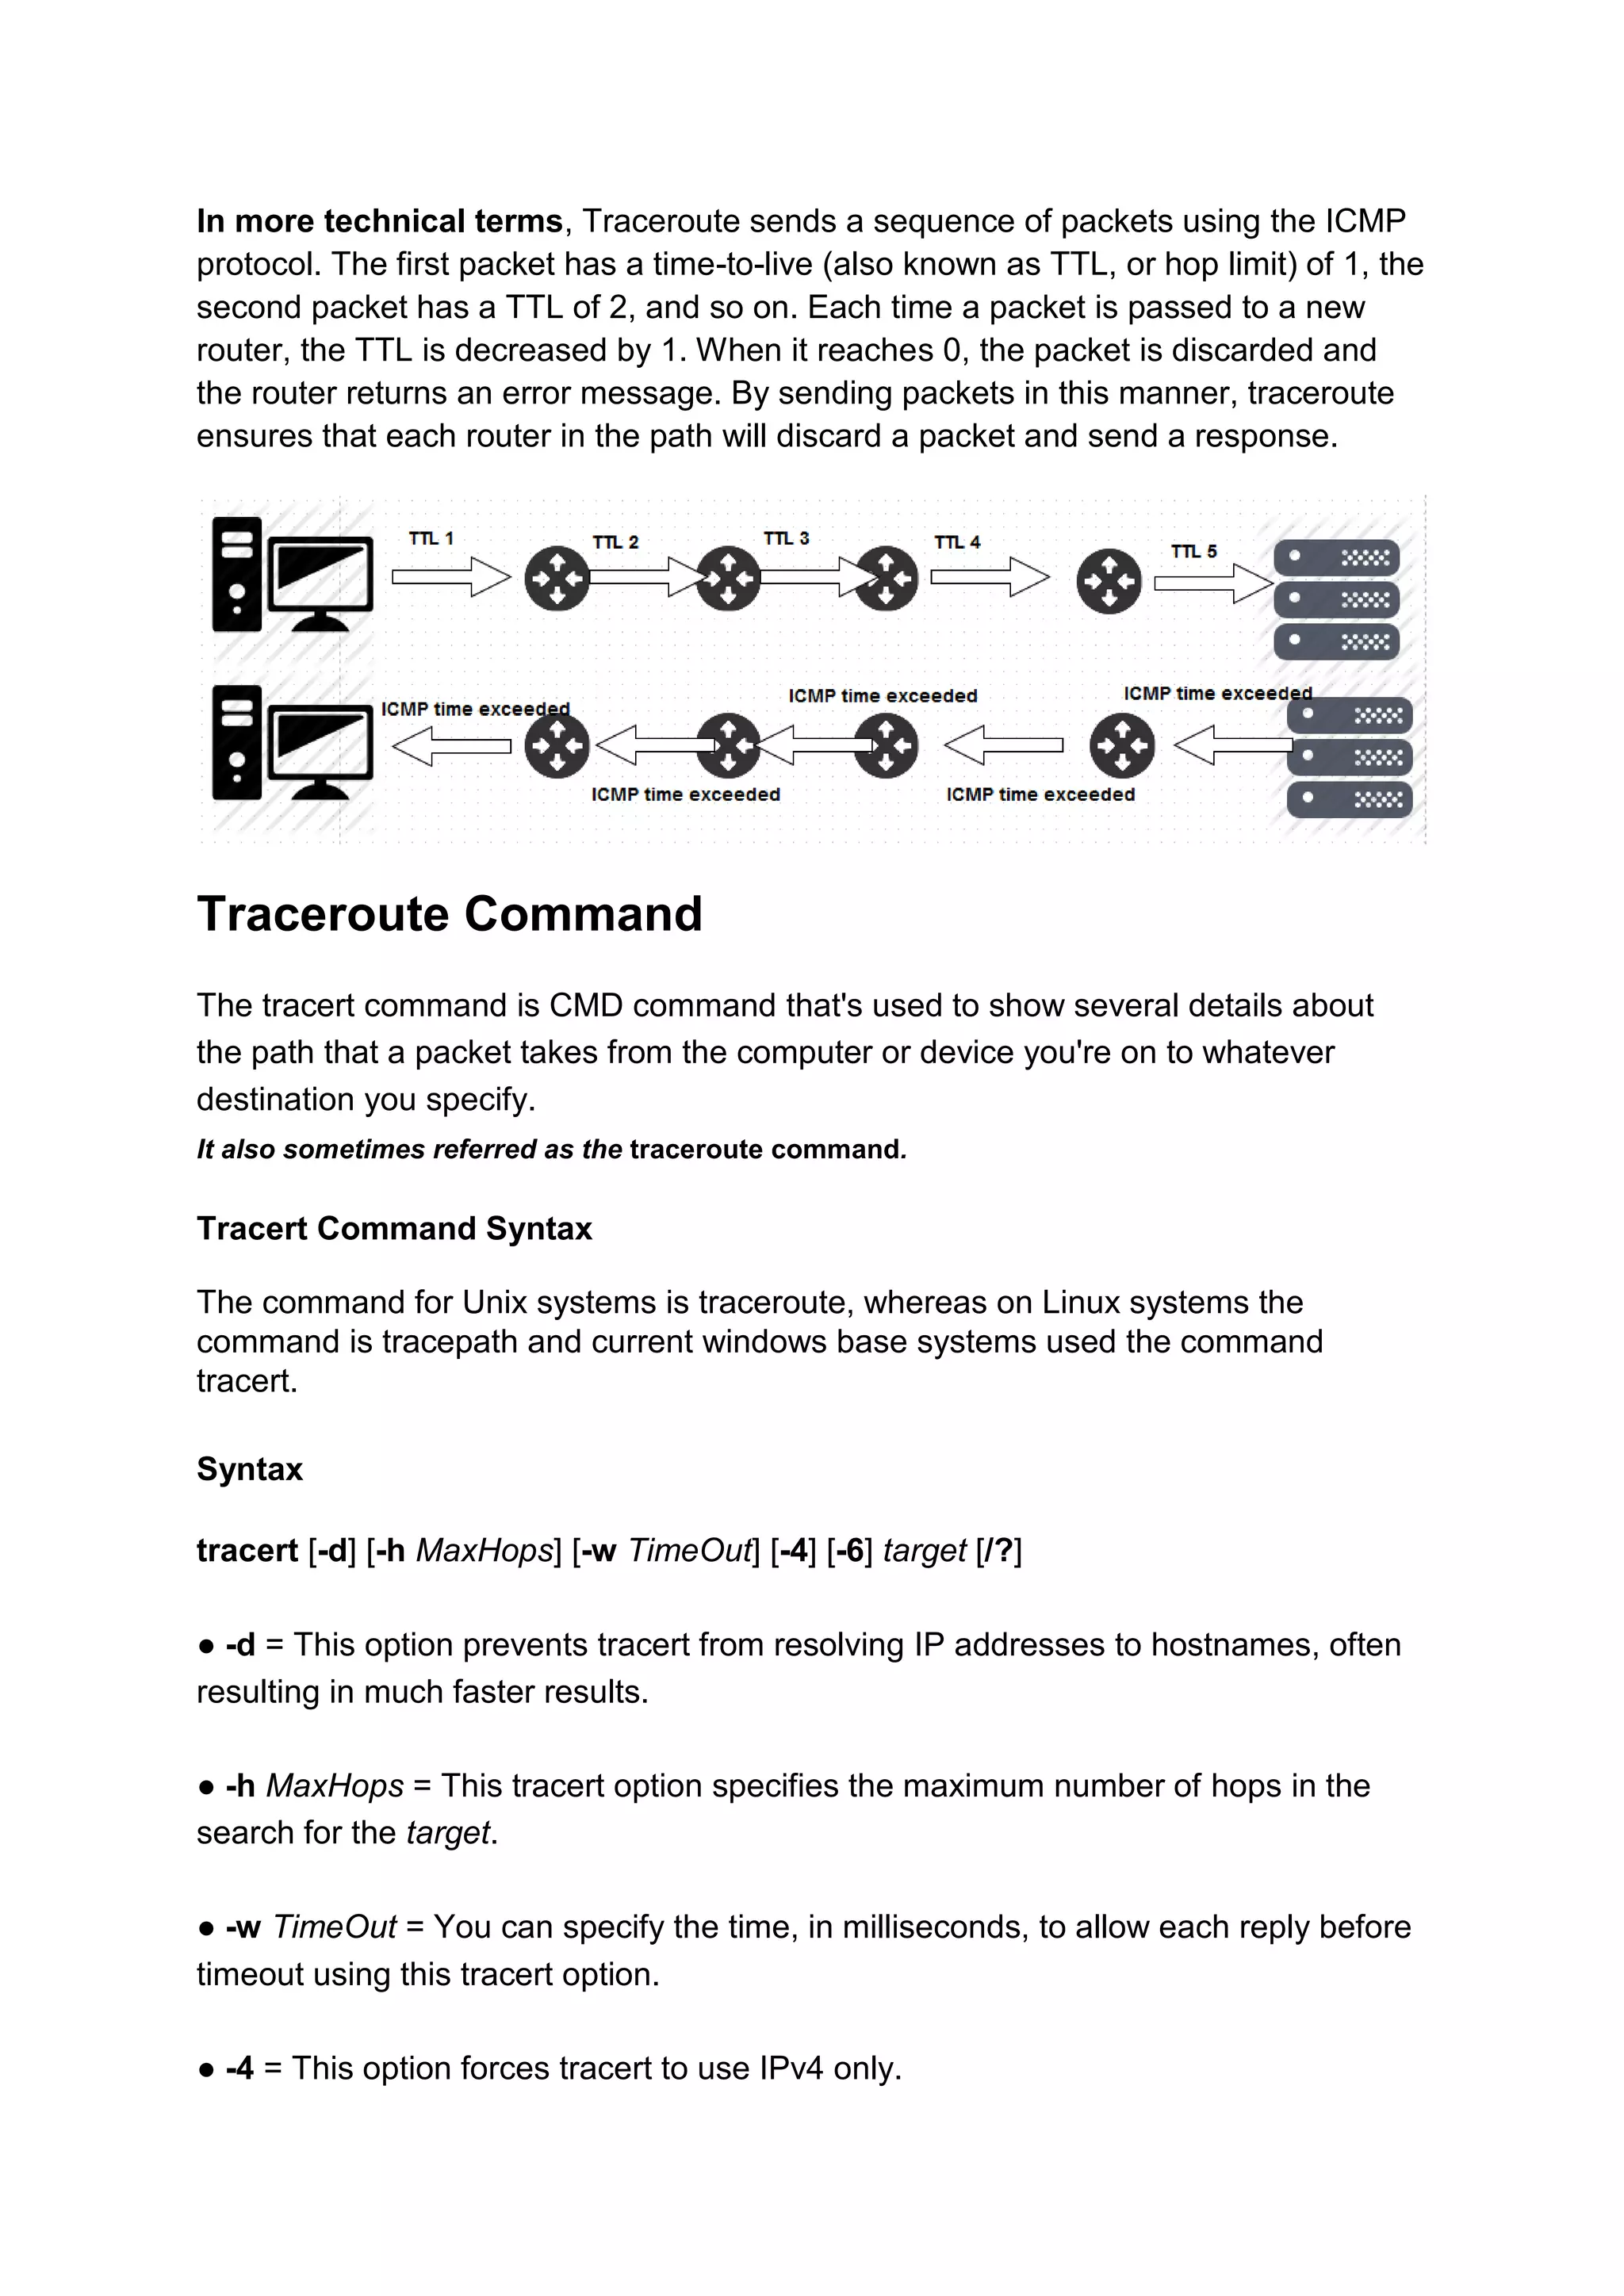
To see this in motion, let's watch a clear, practical demonstration.
Traceroute Explained | Real World Examples
The video 'Traceroute Explained' by CertBros provides a concise explanation of the TTL mechanism and then shows a live demonstration of tracert (the Windows version) while capturing the packets in Wireshark.
Watch the first two sections of the video (00:00 - 07:53). Focus on: The step-by-step explanation of how increasing TTL values discover each hop. The Wireshark analysis, where you can literally see the ICMP 'Time to live exceeded' messages coming from each router.
Hands-On Practice: traceroute
Now, run a traceroute yourself. The command differs slightly by OS:
- On Windows:
tracert google.com - On macOS/Linux:
traceroute google.com
You will see a list of hops. Each line shows the hop number, three round-trip time measurements, and the IP address (and often the hostname) of the router at that hop.
3. The Deep Dive: Expert-Level traceroute Interpretation
Running traceroute is easy. Correctly interpreting it, especially in complex situations, is a skill. A naive reading can lead to incorrect conclusions. Given your goal, we need to go beyond the basics and learn to think like a network engineer.
The most common mistakes involve misinterpreting latency spikes or packet loss.
Tutorial: Troubleshooting with Traceroute
Now for the deep dive. This presentation from NANOG (North American Network Operators' Group) is by a senior network engineer explaining how to properly troubleshoot with traceroute. This gets to the heart of real-world network diagnostics.
This is a dense, expert-level talk. We'll focus on two of the most critical and commonly misunderstood concepts: Prioritization and 'Cosmetic' Latency (32:56 - 43:19): Pay close attention to the distinction between the router's data plane (forwarding real traffic) and its control plane (generating ICMP replies). Understand why a router might be slow to respond to a traceroute probe but still be forwarding your application's data at full speed. The key takeaway: a latency spike or loss that appears at one hop but disappears at subsequent hops is often not a real problem. Asymmetric Paths (43:19 - 51:34): This is a crucial concept. Understand that the path a packet takes to a destination may not be the same as the path it takes on its return journey. Since traceroute latency is a round-trip measurement, a problem on the invisible return path can make the forward path look slow.
The Asymmetric Routing Problem in Practice
The concept of asymmetric routing is so important that it's worth seeing a concrete example. The article from xkln.net provides a perfect lab simulation.
In the article's "Asymmetric Routing - Traceroute edition" section, the author sets up a network where:
- The path from PC to Server is:
PC -> R1 -> R2 -> R3 -> Server - The path from Server to PC is:
Server -> R3 -> R4 -> R5 -> R6 -> R1 -> PC
When a link on the return path (between R5 and R6) is broken, a traceroute from the PC to the Server fails after R2. A naive interpretation would blame R2 or the link after it. However, the forward path is fine! The problem is that the ICMP "Time to live exceeded" messages from R3 and beyond can't get back to the PC because their return path is broken.
The critical lesson: traceroute only shows you the forward path. A problem can appear to be at hop N, but the actual fault could be on the return path from hop N. This is why network engineers always ask for a traceroute in both directions (A -> B and B -> A) to get a complete picture.
Conclusion
You've now added two fundamental tools to your backend engineering toolkit. More importantly, you've begun to understand the nuances of their operation, moving beyond a superficial understanding.
Key Takeaways:
pinguses ICMP Echo Request/Reply to check reachability and measure round-trip latency.tracerouteuses the TTL field in the IP header and ICMP "Time to live exceeded" messages to discover the routers (hops) along a network path.- Interpreting
tracerouteis a skill. A latency spike or packet loss in the middle of a trace is often "cosmetic" due to routers prioritizing forwarding traffic over generating ICMP replies. The issue is only likely real if the high latency persists for all subsequent hops. - Asymmetric routing is common.
tracerouteonly shows the forward path. Problems on the invisible return path can create misleading results. Always try to get a trace from both endpoints for serious diagnostics.
Preview of the Next Lesson:
In this lesson, we saw Wireshark captures of the ICMP messages that ping and traceroute rely on. This gives us a tantalizing glimpse of the raw data flowing across the network. In our next lesson, we will dive headfirst into this world by learning to capture and inspect network packets using a tool like Wireshark or tcpdump. You'll see the TCP handshakes, HTTP requests, and ICMP messages we've discussed at the byte level.