Hello! In our last lesson, we learned to trace the path of network packets using ping and traceroute. We saw how routers along the path would send back ICMP messages, giving us a map of the journey. But we were only seeing the report of the journey, not the packets themselves.
Today, we take the final step in our networking fundamentals module by learning how to see the "ground truth." We will capture and inspect the raw data packets flowing in and out of your machine. This skill is the equivalent of a biologist using a microscope—it allows you to see the fundamental units of communication that everything else is built upon.
Today's Goal: By the end of this lesson, you will be able to capture and inspect network packets using two essential tools: Wireshark, a powerful graphical analyzer, and tcpdump, a lightweight command-line tool.
This is a foundational skill for any serious backend developer, enabling you to debug complex network issues, analyze application behavior, and understand security protocols at the deepest level.
1. Wireshark: Seeing the Network Visually
We'll start with Wireshark, an incredibly powerful and widely-used tool with a graphical user interface (GUI). It's the best tool for learning and for deep, interactive analysis.
Installation and Setup
First, you'll need to install Wireshark. The process is straightforward, but it's crucial to also install the packet capture driver that comes with it (Npcap on Windows) and configure permissions correctly (on Linux/macOS) so the application can access your network interfaces.
Wireshark Crash Course — See All Network Secrets | FULL Beginner to Pro (1 Hour Masterclass)
The video 'Wireshark Crash Course' provides a clear, step-by-step guide to installing Wireshark on Windows, Linux, and macOS. It also gives a quick tour of the interface and how to start your first capture.
Watch the sections on installation and starting your first capture (02:13 - 06:32). Follow the steps for your specific operating system. Pay close attention to the parts about installing Npcap on Windows or setting user group permissions on Linux, as these are critical for the tool to function.
If you prefer a text-based guide, the article "Wireshark Tutorial 2026" also walks through the installation process for each OS.
Wireshark Tutorial 2026: How to Capture and Analyze Network Traffic
For a textual reference on installation, this guide from Nucamp covers the key steps, including the common pitfalls for each operating system.
Read the section 'Install and configure Wireshark correctly'. This reinforces the video's points about installing the Npcap driver and setting up permissions on Linux.
Once installed, launch Wireshark. You should see a list of network interfaces (e.g., Wi-Fi, Ethernet).
The Anatomy of the Wireshark Interface
The Wireshark interface is organized into three main panes, which work together to give you different levels of detail on a selected packet.
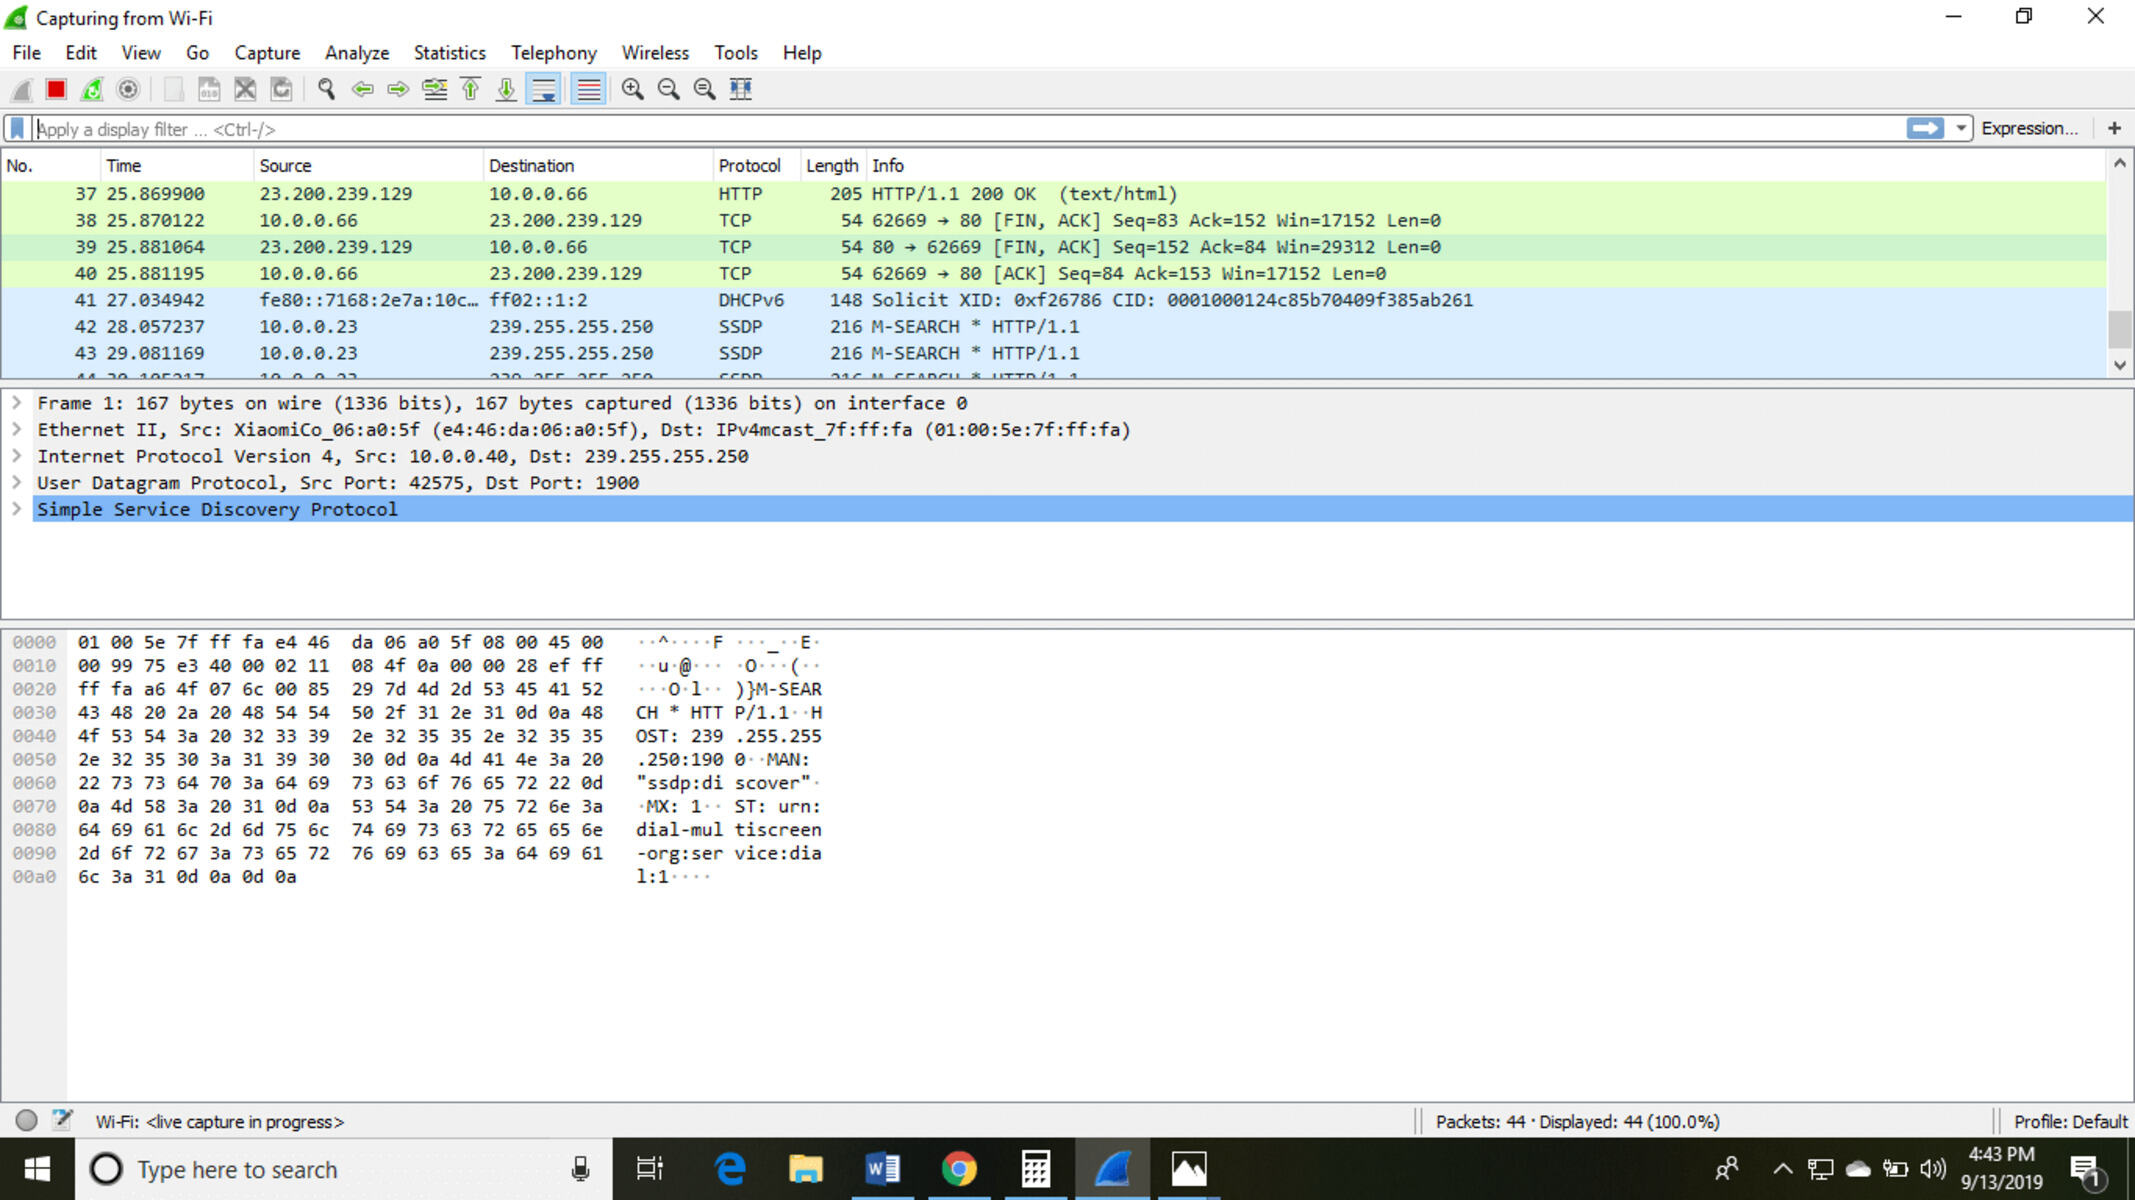
- Packet List Pane (Top): A summary list of all captured packets. Each line is one packet, with columns for time, source/destination IPs, protocol, and a brief info summary.
- Packet Details Pane (Middle): A hierarchical view of the selected packet, broken down by protocol layer (e.g., Ethernet, IP, TCP, HTTP). You can expand each layer to see its specific headers and fields. This is where most of your analysis will happen.
- Packet Bytes Pane (Bottom): The raw data of the selected packet, shown in both hexadecimal and ASCII. This is the "ground truth"—exactly what was sent over the wire.
To learn more about navigating this interface, the article "Wireshark Tutorial 2026" provides a concise explanation.
Wireshark Tutorial 2026: How to Capture and Analyze Network Traffic
Let's solidify your understanding of the interface.
Read the section 'Learn the Wireshark interface: the three panes'. This will help you get comfortable with how the three main sections of the window relate to one another.
Your First Capture: Capture vs. Display Filters
The biggest challenge when using Wireshark is the sheer volume of data. A few seconds of browsing can generate thousands of packets. To manage this, we use filters. It's crucial to understand the two types:
- Capture Filters: Set before you start capturing. They tell Wireshark what to record, and anything that doesn't match is permanently discarded. They use BPF (Berkeley Packet Filter) syntax (e.g.,
host 192.168.1.1orport 80). They are efficient but less flexible. - Display Filters: Applied after capturing (or while capturing). They hide packets from view without deleting them, allowing you to slice and dice your data on the fly. They use Wireshark's own rich filter syntax (e.g.,
ip.addr == 192.168.1.1orhttp.request).
For beginners, it's often best to use no capture filter, capture a short burst of traffic, and then use display filters to analyze it.
The following video section provides an excellent walkthrough of applying display filters.
Wireshark Crash Course — See All Network Secrets | FULL Beginner to Pro (1 Hour Masterclass)
Let's see display filters in action. They are the single most important feature for making sense of network captures.
Watch the segment on display filters (06:59 - 12:31). Pay attention to the syntax for different protocols (IP, TCP, DNS, HTTP) and how you can combine them to zero in on specific traffic.
Hands-On Lab 1: Inspecting the TCP 3-Way Handshake
In a previous lesson, you learned about the TCP 3-way handshake (SYN, SYN-ACK, ACK). Now, let's see it live.
- Open Wireshark and select your active network interface.
- In the display filter bar, type
tcp.port == 80and press Enter. This will only show us traffic on port 80 (HTTP). - Click the blue shark fin icon to start the capture.
- Open your web browser and navigate to an unencrypted site, like
http://info.cern.ch/(the world's first website!). - Once the page loads, go back to Wireshark and click the red square icon to stop the capture.
You should see a short list of packets. Look for the first three:
- A packet from your IP to the server's IP with
[SYN]in the Info column. - A packet from the server back to you with
[SYN, ACK]in the Info column. - A packet from you back to the server with
[ACK]in the Info column.

Click on each of these packets and explore them in the Packet Details pane. Expand the "Transmission Control Protocol" section and look at the "Flags" field. You'll see the corresponding bits set for each packet. You have just witnessed the birth of a TCP connection.
Hands-On Lab 2: Following an HTTP Conversation
Looking at individual packets is useful, but sometimes you want to see the complete conversation. Wireshark can reassemble a TCP stream for you.
With the same capture from the previous lab:
- Find the packet with
GET /...in the Info column. This is your browser's HTTP request. - Right-click on that packet.
- Go to Follow > TCP Stream.
A new window will pop up showing the entire conversation. The text in red is what your client sent (the HTTP GET request), and the text in blue is what the server replied with (the HTTP response and HTML content). This feature is invaluable for debugging application-level protocols.
Wireshark Crash Course — See All Network Secrets | FULL Beginner to Pro (1 Hour Masterclass)
To see a demonstration of following different types of streams (HTTP, SMTP, FTP), watch this section of the 'Wireshark Crash Course'.
Watch the section 'Follow TCP Streams and Reassemble Sessions' (19:29 - 23:45). This will show you how to reconstruct entire conversations from raw packets.
2. tcpdump: The Command-Line Scalpel
While Wireshark is fantastic for visual analysis, as a backend developer, much of your work will be on remote servers via SSH, where you have no GUI. This is where tcpdump shines. It is a lightweight, powerful, command-line packet analyzer available on virtually all Unix-like systems.
Getting Started: Syntax and Basic Capture
tcpdump is likely already installed on your macOS or Linux system. Its basic syntax is:
sudo tcpdump [options] [expression]
[options]: Controltcpdump's behavior (e.g., which interface to use, how much of a packet to capture).[expression]: This is a capture filter using BPF syntax to telltcpdumpwhat traffic to record.
Let's watch a quick introduction to get familiar with the common commands.
TCPDUMP Crash Course | For Network Engineer & Security Analyst
The 'TCPDUMP Crash Course' video provides a great introduction to the tool's purpose, installation, and basic command format.
Watch the introduction and basic commands sections (01:49 - 13:00). Focus on understanding: The key options: -i, -c, -w, -r, -n. The basic filter expressions for host and port. How to save a capture to a file (-w) and read it back (-r).
Practical Filtering with tcpdump
Filtering is essential to avoid being overwhelmed. The filter expressions are powerful and can be combined with logical operators and, or, and not.
Here are some examples that mirror what we did in Wireshark:
- Capture traffic to or from a specific host:
sudo tcpdump -i en0 host example.com - Capture traffic for a specific protocol:
sudo tcpdump -i en0 icmp - Capture traffic on a specific port:
sudo tcpdump -i en0 port 443 - Combine filters:
sudo tcpdump -i en0 src host 192.168.1.10 and dst port 80 - Capture traffic and show packet contents in ASCII:
sudo tcpdump -i en0 -A port 80
The article "How to Debug Network Issues with tcpdump" is an excellent reference for more advanced filtering.
How to Debug Network Issues with tcpdump on Ubuntu
This article serves as a great cheat sheet and deep dive into the various filtering capabilities of tcpdump.
Skim the section 'Filtering by Host, Port, and Protocol' to see the variety of filter expressions available. You don't need to memorize them all, but it's good to know what's possible.
Wireshark and tcpdump: A Backend Developer's Workflow
So, when do you use which tool? They are often used together in a powerful workflow:
-
Capture on the Server with
tcpdump: When debugging an issue on a remote production or staging server, you can't run Wireshark. You usetcpdumpto capture the relevant traffic and save it to a file. The-woption is critical here.# On the remote server: sudo tcpdump -i eth0 -s 0 -w /tmp/debug_capture.pcap 'host 10.20.30.40 and port 5432'(The
-s 0flag ensures you capture the full packet, not just a snapshot). -
Analyze on Your Local Machine with Wireshark: You then transfer the
.pcapfile (e.g., usingscp) from the server to your local machine. You can now opendebug_capture.pcapin Wireshark and use its powerful GUI, display filters, and stream-following capabilities to perform a deep analysis without impacting the server.
This workflow gives you the best of both worlds: the lightweight, remote-friendly capturing of tcpdump and the rich, interactive analysis of Wireshark.
Conclusion
Congratulations! You've completed the networking fundamentals module. You've gone from understanding the abstract layers of the TCP/IP model to tracing packet paths and now, finally, to dissecting the packets themselves.
Key Takeaways:
- Packet analyzers like Wireshark and
tcpdumpare essential for viewing the "ground truth" of network communications. - Wireshark is a GUI-based tool ideal for deep, interactive analysis. Its key features are the three-pane view, powerful display filters, and the ability to follow TCP streams.
tcpdumpis a command-line tool that is indispensable for capturing traffic on remote servers where a GUI is not available. It uses capture filters (BPF syntax) to select traffic.- A common and effective workflow for backend developers is to capture with
tcpdumpon a server and analyze with Wireshark on a local machine.
Preview of the Next Module:
We have built a solid foundation from the physical layer up to the transport layer. Now, we are ready to move up the stack to where your applications live. In our next lesson, we will begin the "HTTP Protocol Inside Out" module by breaking down the structure of an HTTP request and response. Having just seen raw HTTP packets in Wireshark, you are perfectly prepared to understand what each part of that conversation means.