Building on our work from the last lesson, where we mastered loading and inspecting geographic data, we will now connect that spatial data to your project's analytical results. You have built models to predict meal quality violations, and that data exists in a tabular format, likely a pandas DataFrame. To visualize these findings on a map, you need to link your violation rates to the corresponding geographic areas.
This lesson focuses on exactly that: merging your model's prediction data with geographic dataframes. This process, known as an attribute join, is a fundamental operation in geospatial analysis. By the end of this lesson, you will be able to take a standard pandas DataFrame containing your violation scores and cleanly merge it with a GeoDataFrame of district boundaries, creating a single, map-ready dataset. This sets the stage for creating the compelling choropleth maps planned for your project.
Attribute Joins: The Bridge Between Data and Maps
Given your experience with SQL and pandas, the concept of an attribute join will be very familiar. It is analogous to a JOIN in SQL or pd.merge() in pandas. The goal is to combine two tables—in this case, a pandas DataFrame and a GeoPandas GeoDataFrame—using a common column, often called a key.
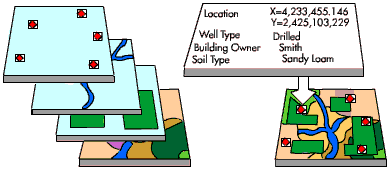
For your project, the process will look like this:
- Geographic Data: A
GeoDataFramewhere each row represents a district, and thegeometrycolumn contains the polygon shape of that district. - Attribute Data: A pandas
DataFramewhere each row contains a district's name and its calculated violation rate. - The Join: You'll merge these two based on the district name column, adding the
violation_rateto theGeoDataFrame.
The Merging Process in GeoPandas
Because GeoPandas is built on pandas, you can use the same merge functionality you are already familiar with. The key is to ensure your data is properly prepared before the merge.
The following resource provides a methodical guide to this process. It uses census data and tract boundaries, but the principle is identical to merging your violation data with district boundaries.
Merge Data & Dissolve Polygons
This tutorial from pygis.io details the practical steps of preparing and merging a non-spatial DataFrame with a GeoDataFrame.
Start by reading the section Preparing for the Join. This part is crucial as it demonstrates how to create a common key column (GEOID in their example) if one doesn't already exist. Next, read the sections Cleaning Up and Performing the Merge. Pay close attention to the data cleaning steps (checking data types, removing unnecessary columns) and the syntax of the .merge() method.
As you saw, there are two critical preconditions for a successful merge:
- A Common Key: Both your
GeoDataFrameand your pandasDataFramemust have a column that uniquely identifies each geographic entity (e.g., district name or an official P-code). - Matching Values: The values within these key columns must match exactly. "Mumbai" is different from "mumbai" or "Mumbai ". You will often need to standardize your keys by converting them to the same case (e.g.,
.str.lower()) and stripping leading/trailing whitespace (.str.strip()).
An India-Specific Example
Let's look at another example that is geographically relevant to your project. This article merges data on English speakers with a shapefile of Indian states. It uses a slightly different but common pandas syntax (.set_index().join()) to achieve the same result as .merge().
Visualize data on a Choropleth map with Geopandas and Matplotlib
This Medium article provides a concise, end-to-end example of joining data for visualization in India.
First, quickly review Step 3 and Step 4, which show the loading of the two separate dataframes. Then, focus carefully on Step 5. The author merges the statistical data (csv_df) with the map data (map_df) using the state name as the common key. Notice how they handle the key columns having different names (st_nm vs. State).
Video Walkthrough: Putting it All Together
To solidify your understanding, the following video demonstrates the entire workflow: loading a shapefile, loading a separate CSV with data, preparing the data, and performing the merge.
Create AMAZING Maps with Python! (GeoPandas Tutorial for Choropleth Maps)
This tutorial from the datagy channel is an excellent visual guide to merging data for a choropleth map.
Watch the first part of the video, from data preparation, where the presenter loads and cleans a standard pandas DataFrame. Then, pay close attention to the segment from the merge operation. This is the core of the lesson. The presenter clearly explains how to use pd.merge, specifying the left_on and right_on parameters to join the two dataframes on their respective key columns ('name' and 'state').
A Quick Note: Attribute vs. Spatial Joins
The merge operation we've been discussing is an attribute join. You are joining based on common values in a column. GeoPandas also supports a spatial join (gpd.sjoin), which joins dataframes based on their geometric relationship (e.g., points that are within a polygon, or polygons that intersect).
While your current task requires an attribute join, it's useful to understand the distinction. Watch the beginning of this next video for a clear conceptual explanation.
This video by Jonathan Soma explains the fundamental difference between column joins and spatial joins.
Watch the first minute, from the introduction. The explanation clearly contrasts joining by a common column with joining based on a shared geographic space.
For your project's goal of mapping violation rates per district, the merge (attribute join) is the correct tool because you are linking data using a shared identifier—the district name.
Conclusion
In this lesson, you've learned the critical technique for linking your project's analytical results to geographic data. This bridge is what makes geospatial analysis possible, turning raw numbers into insightful visualizations.
Here are your key takeaways:
- Attribute Join: You can merge a standard pandas
DataFramewith aGeoDataFrameusing the.merge()method, which functions just as it does in pandas. - The Importance of Keys: A successful merge depends on having a clean, consistent key column in both dataframes. Data preparation to standardize these keys is a vital step.
- The Result: The output of the merge is a single, enriched
GeoDataFramethat contains both the geometric shapes and the attribute data (like your violation scores) for each location.
You are now fully prepared for the final step in creating your hotspot map. In the next lesson, we will use this merged GeoDataFrame to create choropleth maps, which will visually represent the geographic distribution of meal quality violations across different regions.
