Hello! Welcome back to your affiliate marketing course.
In our last lesson, you accomplished a critical technical task: installing and verifying your Google Analytics tracking code. You now have a system in place to collect data about everyone who visits your website. Now, the exciting part begins: learning how to turn that raw data into valuable business intelligence.
This lesson addresses the learning outcome: Navigate the basic Google Analytics reports to find audience and traffic source data. We will explore the "who" and "where" of your website traffic, answering two fundamental questions for any affiliate marketer:
- Who are the people visiting my site?
- Where are they coming from?
Answering these questions will help you understand if your marketing efforts are attracting the right audience and which channels are the most effective, allowing you to focus your energy where it matters most.
Getting Your Bearings: The Google Analytics 4 Interface
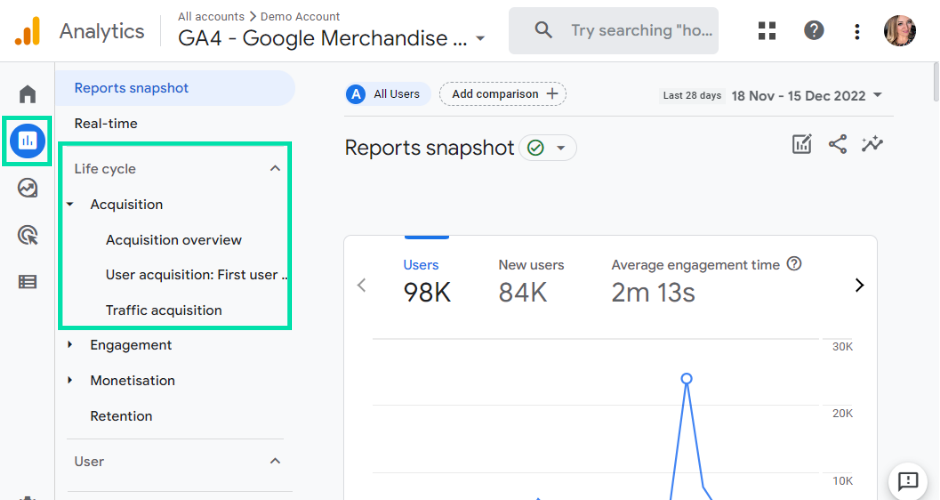
By now, 24-48 hours should have passed since you installed your tracking code, which means data should be starting to appear in your standard reports. When you log in and navigate to the Reports section, you'll see a dashboard similar to this, called the Reports snapshot.

The main navigation for reports is on the left-hand side. We will focus on the "Life cycle" and "User" collections.
Part 1: Where Do Your Visitors Come From? (Traffic Data)
Knowing where your visitors originate is essential. Did they find you through a Google search? Did they click a link from your Facebook page? Or did they type your website address directly into their browser? The Acquisition reports answer these questions.
First, let's establish why this is so important.
A Guide to Acquisition Reports in Google Analytics 4
Before diving into the reports, it's helpful to understand what you can achieve with them. This article from Analytics Mania explains how acquisition data can help you identify your best-performing marketing channels and find weak spots that need improvement.
Read the introductory section titled 'Why are Acquisition reports important?'. This will frame your thinking as you start to analyze your own data.
User Acquisition vs. Traffic Acquisition
Google Analytics offers two primary ways to look at your acquisition data, and understanding the difference is key.
- User Acquisition: Focuses on the traffic source that brought a user to your site for the very first time.
- Traffic Acquisition: Focuses on the traffic source for each individual visit (or "session").
For example, if someone discovers your blog via a Google search today and then comes back tomorrow by clicking a link in your email newsletter, the User Acquisition report would credit both visits to Google. The Traffic Acquisition report, however, would credit the first visit to Google and the second visit to your email newsletter.
As a beginner, the Traffic Acquisition report is often more useful for seeing the immediate impact of your day-to-day marketing activities.
A Guide to Acquisition Reports in Google Analytics 4
Grasping the distinction between user and traffic acquisition is one of the most important foundational concepts in GA4. This reading provides an excellent visual explanation and a clear comparison table.
Read the section titled 'User Acquisition vs Traffic Acquisition'. Pay close attention to the diagram and the comparison table to solidify your understanding.
Navigating the Traffic Acquisition Report
Now, let's get practical. Let's see how you can find and interpret this data in your own account.
Google Analytics 4 tutorial for beginners (2026 update) || GA4 tutorial for beginners || GA4 course
This video from Analytics Mania provides a clear, concise walkthrough of the Traffic Acquisition report, demonstrating how to access the most important information.
Watch the segment from 16:50 to 19:15. The presenter focuses on the Traffic Acquisition report. Notice how he switches the primary dimension from 'Session default channel grouping' to the more detailed 'Session source/medium'. This is a key skill you will use frequently.
As you saw in the video, you can analyze your traffic using different "dimensions":
- Session default channel grouping: These are broad, default categories that Google uses to group your traffic. Common examples include:
- Organic Search: Visitors who arrived from a search engine like Google or Bing.
- Direct: Visitors who typed your URL directly or used a bookmark.
- Referral: Visitors who clicked a link from another website.
- Organic Social: Visitors who clicked a link from a social media platform (e.g., Facebook, Pinterest, Twitter).
- Session source / medium: This gives you a more granular view. For example, instead of just "Organic Search," you'll see
google / organic. Instead of just "Referral," you might seefacebook.com / referral.
Action Step: Go to your own Google Analytics account. Navigate to Reports > Acquisition > Traffic Acquisition. Find the dropdown menu at the top-left of the table and practice switching the primary dimension between Session default channel group and Session source / medium.
Part 2: Who Are Your Visitors? (Audience Data)
Now that you know where your visitors come from, let's find out who they are. Understanding your audience's demographics (like their location and age) and the technology they use (like their device) helps you create more relevant content and ensure your website provides a good experience for them.
These insights are found in the User reports section.
A beginner's guide to Google Analytics 4 [2025]
This blog post from Productive Blogging is written for beginners and provides a very clear guide to finding the most useful audience and technology reports.
Read the following three short sections to learn where to find key audience data: 'REPORTS => USER => USER ATTRIBUTES => OVERVIEW': This explains where to find gender, age, and interest data. Crucially, it also explains why this data might be missing (a common point of confusion for beginners). '...DEMOGRAPHIC DETAILS => COUNTRY': This shows you how to find out where in the world your audience lives. 'REPORTS => USER => TECH => TECH DETAILS': This section shows you how to discover what devices your visitors use (mobile vs. desktop).
In summary, you can find out:
- Where they live:
User > User Attributes > Demographic details(Drill down by Country, Region, or City). - Who they are:
User > User Attributes > Demographic details(Age, Gender - note that data may be limited). - What technology they use:
User > Tech > Tech details(Device category, Browser, Operating System).
This isn't just trivia; it's actionable intelligence. If you discover that 80% of your visitors are on mobile, you know your website must be fast and easy to navigate on a phone. If your audience is primarily in a specific country, you can tailor your content to their culture and language.
Your Turn: Explore Your Data
It's time to apply what you've learned. Open your Google Analytics account and try to answer the following questions.
Note: If your website is brand new, your reports might still be mostly empty. That's perfectly normal! Bookmark this lesson and return in a week when you have more data to analyze.
-
Task 1: Identify Your Top Traffic Source.
- Go to
Reports > Acquisition > Traffic Acquisition. - Look at the table using the
Session default channel groupdimension. Which channel has brought you the most users so far?
- Go to
-
Task 2: Identify Your Top Country.
- Go to
Reports > User > User Attributes > Demographic details. - Which country is at the top of the list?
- Go to
-
Task 3: Check Your Device Split.
- Go to
Reports > Tech > Tech details. - Change the primary dimension from
BrowsertoDevice category. What percentage of your users are on "mobile" versus "desktop"?
- Go to
Completing this exercise will give you your first data-driven snapshot of your affiliate marketing business.
Conclusion
Congratulations! You've moved beyond simply collecting data to actively interpreting it. You now know how to navigate the fundamental reports in Google Analytics to understand who your audience is and how they're finding your website.
Key takeaways from this lesson:
- The Traffic Acquisition report (
Reports > Acquisition) is your go-to place for understanding where your visitors come from. - The User Attributes and Tech reports (
Reports > User) tell you who your visitors are by detailing their location, demographics, and technology. - The
Session source / mediumdimension provides a more detailed breakdown of your traffic channels than the default grouping. - Analyzing this data is the first step toward making informed decisions to grow your affiliate business.
Preview of the next lesson:
Knowing your audience is the first step. The next is creating content that speaks directly to their needs. In our next lesson, we'll enter the world of content strategy and learn how to map your audience's specific problems (their "pain points") to the solutions offered by your chosen ClickBank product. This is the key to creating high-value content that builds trust and drives conversions.