In our previous lesson, we introduced the Butler-Volmer equation, the master equation that connects applied potential to the current response at an electrode. We saw that it incorporates two key parameters: the exchange current density (), reflecting the intrinsic speed of the reaction, and the transfer coefficient (). While we defined as a numerical factor in the equation, its physical significance is profound.
This lesson delves into the heart of the transfer coefficient. Our goal is to understand what truly represents and how it governs the symmetry of an electrochemical reaction. You will learn to interpret its value not as an abstract parameter, but as a descriptor of the reaction's energy landscape. This understanding is critical for moving beyond data fitting to interpreting the kinetic behavior of the catalysts you develop, such as your Ni-Fe/MXene systems for water electrolysis.
1. The Physical Meaning of the Transfer Coefficient
At its core, the transfer coefficient, , describes how the activation energy barrier of a reaction responds to a change in the electrode potential. Recall from our previous discussion that applying an overpotential () alters the Gibbs free energy of the reactants and products, thus changing the driving force for the reaction. However, this electrical energy does not affect the forward (cathodic) and backward (anodic) reactions equally. The transfer coefficient tells us how this energy is partitioned.
Let's visualize this with a Gibbs free energy diagram for a simple one-electron redox reaction, .
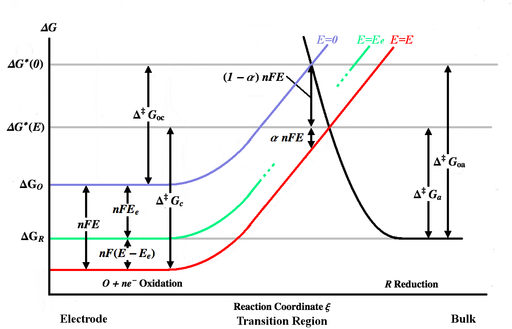
In this diagram:
- The reaction proceeds from the oxidized state (O) on the left to the reduced state (R) on the right.
- The peak of the black curve represents the transition state, and the height from the reactant/product valley to this peak is the activation energy ().
- At the equilibrium potential (green curve), the forward and backward activation barriers are fixed, leading to equal and opposite rates ().
When we apply a potential that is different from , the free energy of the electron at the electrode changes. This shifts the energy level of the species containing the electron, , by an amount , which is equal to . The crucial point is how this energy shift affects the activation barrier.
The transfer coefficient is defined as the fraction of the applied potential energy that facilitates the cathodic (reduction) reaction by lowering its activation barrier.
- Change in cathodic activation energy:
Consequently, the remaining fraction, , acts to impede the anodic (oxidation) reaction by raising its activation barrier.
- Change in anodic activation energy:
As you can see in the diagram, when we apply a potential (red curve), the total energy change is . This total change is split: a portion, , alters the cathodic barrier, and the remaining portion, , alters the anodic barrier relative to the transition state. (Note: The diagram uses instead of , but the principle is identical).
This partitioning is precisely what we saw mathematically when we first introduced the Butler-Volmer equation. For a quick refresher on how this concept is formalized, you can revisit the derivation in the NPTEL lecture notes we used previously.
[PDF] Electrode Kinetics - Significance of Overpotentials
These lecture notes formally define the potential dependence of the activation energy.
In the chapter "KINETICS OF ELECTRODE REACTIONS," locate the section that follows the introduction of the forward and backward rate constants. Focus on equations (7) and (8) and the accompanying text. This is where the Gibbs free energies of activation are explicitly modified by the potential-dependent terms involving \alpha, providing the mathematical basis for the energy diagram above.
2. Interpreting the Value of : Symmetry vs. Asymmetry
The value of typically falls between 0 and 1. Its specific value tells us about the symmetry of the activation barrier.
The Symmetric Case:
This is the most commonly assumed value in introductory treatments and is often a good first approximation.
- Meaning: An of 0.5 implies a perfectly symmetric energy barrier. The applied potential energy is distributed equally to lower the cathodic barrier and raise the anodic barrier.
- Transition State: This suggests the transition state is located symmetrically between the reactant and product states along the reaction coordinate.
- Result: The current-potential curve is symmetric around the equilibrium potential. The anodic and cathodic branches have the same shape, just mirrored.
The Asymmetric Cases:
When deviates from 0.5, the energy barrier is asymmetric, and the potential influences one direction of the reaction more than the other.
-
Case 1: (e.g., )
- Meaning: The barrier is "anode-like." Only a small fraction () of the potential energy assists the reduction, while a large fraction () assists the oxidation. The reaction is more sensitive to potential changes in the anodic direction.
- Transition State: The transition state structurally resembles the reactants of the reduction (the oxidized species, O).
- Result: The current-potential curve is skewed. The anodic current rises more steeply with overpotential compared to the cathodic current.
-
Case 2: (e.g., )
- Meaning: The barrier is "cathode-like." A large fraction () of the potential energy assists the reduction. The reaction is more sensitive to potential changes in the cathodic direction.
- Transition State: The transition state structurally resembles the products of the reduction (the reduced species, R).
- Result: The current-potential curve is skewed in the opposite direction. The cathodic current rises more steeply with overpotential.
The following video provides an excellent visual demonstration of this effect. Watch how the shape of the current-overpotential curve changes as the value of is adjusted.
Introduction to Tafel Plot/Equation, Butler-Volmer Equation and Foot-of-Wave-Analysis (FOWA)
This video from ZimmerPeacock clearly illustrates the role of alpha as a symmetry factor.
First, watch the conceptual introduction of alpha from alpha is interesting. Then, pay close attention to the graphical demonstration starting at if we look at the equation, where the presenter shows how changing alpha from 0.5 to 0.2 and 0.8 skews the preference of the reaction towards the anodic or cathodic direction, respectively.
The physical origin of this asymmetry lies in the shape of the potential energy surfaces of the reactant and product. If one side of the energy well (e.g., for the reduced species R) is much steeper than the other, the location of the transition state (the intersection point) will be closer to the shallower well. A change in potential will then have a different geometric effect on the barrier height for each direction.
[PDF] Lecture #19 of 20+ - UCI Department of Chemistry
These lecture slides from UC Irvine provide a more advanced graphical interpretation of the transfer coefficient.
Skim through the slides starting from the one titled "...now, more specifically, α (actually β) is related to the symmetry of the barrier..." (slide 857). The diagrams on slide 858 and slide 859 illustrate how the relative steepness of the potential energy curves for the oxidized (O) and reduced (R) species determines whether \alpha is greater or less than 0.5.
3. Why Matters in Your Research
Understanding the transfer coefficient is not just a theoretical exercise; it has direct implications for interpreting the mechanisms of complex reactions like the Hydrogen Evolution Reaction (HER) and Oxygen Evolution Reaction (OER).
For a multi-step reaction, the experimentally observed transfer coefficient (often called the apparent transfer coefficient) is related to the mechanism, specifically the rate-determining step (RDS) and the number of electrons transferred before and during that step. Different mechanistic pathways predict different relationships between current and potential, which manifest as different apparent values (and corresponding Tafel slopes, as we will see soon).
For example, in your study of HER, you know it can proceed through different combinations of the Volmer, Heyrovsky, and Tafel steps. By analyzing the current-potential data, you can extract an apparent . Comparing this experimental value to the values predicted by theoretical models for each mechanism can provide strong evidence for which pathway is dominant on your catalyst surface.
The NPTEL document you've seen before explicitly makes this connection.
[PDF] Electrode Kinetics - Significance of Overpotentials
This chapter connects the theoretical kinetic parameters to the practical study of the HER mechanism.
In "CHAPTER 4: HYDROGEN EVOLUTION REACTION," notice how the text introduces the key parameters for mechanism elucidation. It states that three essential parameters aid in this process, with the symmetry factor (\alpha) being one of them. Following this, read the brief section on the "Analysis of Tafel slopes", which explains that this method, which depends on \alpha, is a powerful tool for gaining mechanistic clues.
This is the deeper layer of analysis your goal of "designing experiments" requires. By understanding what signifies, you can better interpret why one Ni-Fe/MXene formulation might show different kinetic behavior than another, potentially pointing to changes in the reaction mechanism itself.
Conclusion
In this lesson, we have unpacked the physical meaning behind the transfer coefficient. It is far more than just a fitting parameter in the Butler-Volmer equation.
Key Takeaways:
- The transfer coefficient () describes how the applied potential energy is partitioned between the anodic and cathodic activation barriers of a redox reaction.
- An value of 0.5 indicates a symmetric energy barrier, where the potential affects both anodic and cathodic processes equally.
- An value deviating from 0.5 indicates an asymmetric barrier, where the potential preferentially accelerates either the oxidation () or the reduction ().
- The value of is related to the position of the transition state and provides clues about the reaction mechanism, particularly the rate-determining step.
Preview of the Next Lesson:
We've established the theoretical importance of and . But how do we measure them? In the next lesson, we will explore the Tafel equation, a simplified form of the Butler-Volmer equation valid at high overpotentials. We will see how this leads to the Tafel plot, a standard analytical tool in electrocatalysis that allows you to extract both the exchange current density and the transfer coefficient directly from the polarization curves you measure in the lab.