Hello! Welcome to the final lesson in our module on Web Fundamentals and HTTP.
Over the past few lessons, we've built a solid theoretical foundation, covering the client-server model, URLs, HTTP methods, status codes, headers, and the concept of statelessness. You now understand the components of the conversation that happens between a browser and a server.
Today, we'll bring all that theory to life. This lesson is all about practice. We're going to pull back the curtain on web communication and directly observe it using a tool you'll rely on daily as a backend developer. The learning outcome for this session is to: Use browser developer tools to inspect HTTP traffic for a web application.
Mastering this tool is non-negotiable for backend work. It's how you'll debug your own APIs, understand how frontend applications interact with your services, and analyze the performance of your applications.
Let's get started.
1. Opening the Network Panel
Every modern web browser comes with a powerful suite of developer tools. Our focus will be on the Network panel, which records all network activity a webpage initiates.
We will primarily use Google Chrome for our examples, but the tools in Firefox, Safari, and Edge are very similar.
To get a quick and clear introduction, let's start with a short video from the official Chrome team.
Inspect Network Activity - Chrome DevTools 101
This video, 'Inspect Network Activity - Chrome DevTools 101', provides a perfect starting point. It will show you how to open the DevTools, navigate to the Network panel, and understand the basic layout.
Please watch from the beginning up to 01:16. The key takeaway is simply how to get the tool open and see the initial network log after a page reload.
As you saw, you can open DevTools with a right-click ("Inspect") or a keyboard shortcut (Control+Shift+J or Command+Option+J on Mac), then click the "Network" tab. Remember the most important tip: DevTools only logs network activity while it's open. You almost always need to reload the page after opening the panel to see the page load traffic.
2. Understanding the Network Log
After you reload a page, the Network panel populates with a list of requests, often called the "Network Log." Each row represents a single resource that the browser requested.
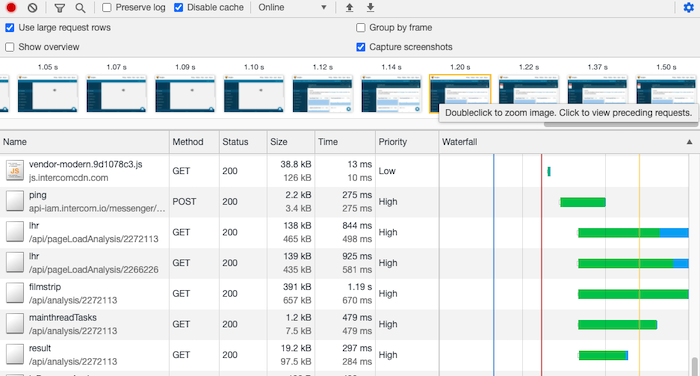
Let's break down the most important columns. While the video touched on these, a solid understanding is crucial.
- Name: The filename or path of the resource being requested (e.g.,
index.html,main.css,logo.png). - Status: The HTTP status code returned by the server. You'll become very familiar with
200 OK,404 Not Found,302 Found(redirect), and500 Internal Server Error. - Method: The HTTP method used for the request, such as
GETorPOST. - Type: The MIME type of the resource, determined by the
Content-Typeresponse header (e.g.,document,stylesheet,script,image). - Initiator: What caused the request. The first request is usually initiated by you typing a URL. Subsequent requests are often "initiated" by the main HTML document (e.g., a
<script>tag in the HTML causes a request for a JavaScript file). - Size: The amount of data transferred. This is key for performance analysis.
- Time: How long the request took from start to finish.
- Waterfall: A visual breakdown of the request's lifecycle. It shows how long the browser spent waiting, connecting, and downloading. It's invaluable for spotting performance bottlenecks.
3. Deconstructing a Single HTTP Exchange
The real power of the Network tool comes from inspecting a single request in detail. When you click on any resource in the log, a new pane opens with several tabs.
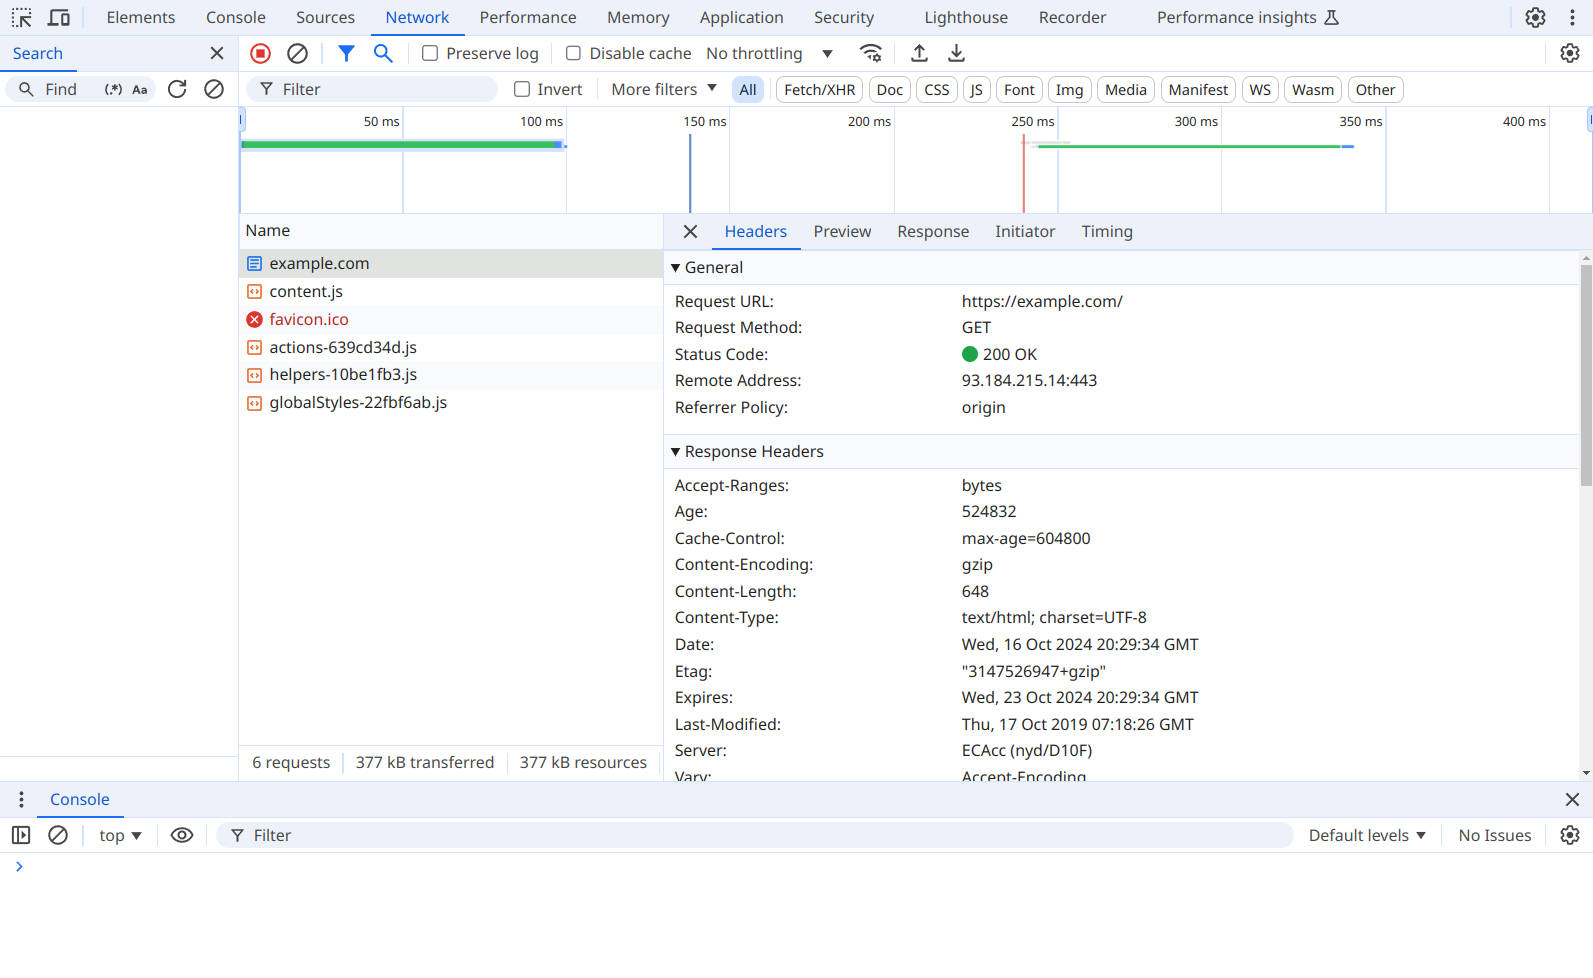
Let's explore the most critical tabs: Headers, Response, and Preview.
Inspect network activity | Chrome DevTools
The official Chrome documentation, 'Inspect network activity', provides a clear, step-by-step guide to exploring a resource's details. It's a great reference to have.
Please read the section titled 'Inspect a resource's details'. This will walk you through the purpose of the Headers, Preview, Response, and Timing tabs. Follow along by opening the network tab on a simple site like example.com.
To summarize and connect this to our previous lessons:
- Headers Tab: This is where theory meets reality. You will see:
- General: The Request URL, Request Method (
GET), and Status Code (200 OK). - Response Headers: Metadata from the server, such as
Content-Type,Content-Length,Date, and—connecting to our last lesson—theSet-Cookieheader if the server is starting a session. - Request Headers: Metadata from the client, like
User-Agent(your browser),Accept-Encoding(what compression formats it supports), and theCookieheader on subsequent requests.
- General: The Request URL, Request Method (
- Response Tab: This shows the raw content returned by the server. For an HTML file, you'll see the source code. For an API call, you'll see the raw JSON or XML.
- Preview Tab: This shows a rendered version of the response. For an HTML file, it looks like a mini-webpage. For a JSON response, it gives you a collapsible tree view, which is much easier to read than the raw text.
Test your understanding!
Imagine you are building a Django backend. A user reports that when they try to access a specific page, they get a "Page Not Found" error. You suspect your Django URL routing is misconfigured.
Which tab in the Network panel would you check first to confirm that your server is indeed sending a "Not Found" response, and what specific information would you look for?
Show answer
You would first look at the main Network Log. Find the row for the requested page (e.g., /my-buggy-page/) and look at the Status column. You would expect to see a 404 status code.
Then, you could click on that request and go to the Preview or Response tab. Django's default 404 page is a distinct HTML document. Seeing that rendered HTML would confirm that the request reached Django, but no URL pattern matched it. If you saw a different error (like a generic browser 404 page), it might mean the request never even reached your Django server.
4. Analyzing a Complex Page Load
Simple pages make one request. Modern applications make dozens or even hundreds. They request the main document, which then triggers requests for stylesheets, scripts, images, fonts, and API data. This is where you can see the "under the hood" complexity of the web.
The following video provides an excellent, in-depth analysis of a real-world site, connecting network activity directly to different HTTP protocols and performance. Given your interest in backend internals, this will be particularly insightful.
Demystifying the Browser Networking Tab in Developer Tools With Examples
The video 'Demystifying the Browser Networking Tab' from Hussein Nasser goes beyond the basics. It examines the network traffic of a real website, nginx.org, to show how a single page load creates a cascade of requests.
Watch from 04:31 to 20:21. Don't worry about catching every single detail. Focus on observing these key phenomena: How the initial HTML document initiates requests for other resources (images, JS files). Requests to other domains for tracking or ads (e.g., Google, Facebook). HTTP redirects (like the 307 status code) and the performance cost of making extra requests. The difference in how HTTP/1.1, HTTP/2, and HTTP/3 (QUIC) handle multiple requests. Notice how HTTP/2 and HTTP/3 can reuse a single connection for many requests (multiplexing), which is a major performance enhancement.
This deep dive shows that the Network panel isn't just for checking if a file loaded; it's a diagnostic tool for understanding performance, security (unencrypted HTTP requests), and protocol-level behavior.
5. Practical Skills: Filtering and Throttling
When debugging a complex application, you need to cut through the noise. The Network panel provides powerful tools for filtering requests and simulating different network conditions.
- Filtering: You can filter requests by type (e.g.,
JS,CSS, orFetch/XHRfor API calls), by domain, or by a free-text search in the URL. As a backend developer, you'll constantly use theFetch/XHRfilter to isolate the API requests your frontend is making. - Disabling Cache: By checking "Disable cache," you ensure that every time you reload, the browser re-fetches every resource from the server, rather than loading it from its local cache. This is essential for testing changes to your backend code.
- Throttling: You can simulate slower network connections (like "Slow 3G") to understand how your application performs for users on slower networks.
The official documentation provides a great walkthrough of these features.
Inspect network activity | Chrome DevTools
Let's return to the 'Inspect network activity' documentation to learn how to use these practical features.
Read the sections 'Simulate a slower network connection' and 'Filter resources'. Try these features out on a complex website like a news site or social media feed.
Conclusion
You've now completed your tour of the browser's Network panel, the backend developer's most essential debugging tool. This practical skill bridges the gap between the theory of HTTP and the reality of web applications.
Key Takeaways:
- The Network panel logs all HTTP requests a page makes while the tool is open.
- You can inspect the full details of any request, including its method, status, headers, and response body.
- This tool allows you to see the entire cascade of requests initiated by a single page load, including those for CSS, JavaScript, images, and APIs.
- Practical features like filtering, disabling the cache, and network throttling are crucial for effective debugging and performance analysis.
Preview of the Next Lesson:
This lesson concludes our foundational module on Web Fundamentals and HTTP. You now have the conceptual and practical knowledge of how web clients and servers communicate.
Starting with the next module, Introduction to Django, we will shift our focus entirely to the server side. You'll set up your development environment, install Django, and write your very first view function to handle an incoming HTTP request and return a response. It's time to start building