Hello! Welcome to the third lesson in our "Automation Fundamentals" module.
In our last session, we established the core structure of any automation: a trigger that starts the workflow (the "when") and one or more actions that perform the tasks (the "what"). You've seen a brief example of how this looks inside a tool like Make.com.
Today, we're going to dive deeper into that visual representation. This lesson will explain exactly how no-code tools use a visual language of nodes and connections to build workflows. Think of it as learning the alphabet before you start writing sentences. Understanding this visual language is the key to building, reading, and troubleshooting any automation you create.
From Instructions to a Flowchart
Imagine you're trying to explain a process to someone. You could write it down as a list of instructions, like a recipe. But often, a flowchart is much easier to understand at a glance. It shows not just the steps, but also how they relate to each other and the order in which they happen.
No-code automation tools work exactly like this. Instead of writing code, you build a visual flowchart.

In this visual world, the building blocks of your flowchart are called nodes, and the arrows linking them are called connections.
What are Nodes?
A node is a single step in your workflow. It's a pre-built block of functionality that represents either a trigger or an action.
- A Trigger Node is always the first node. It's the event that starts your workflow.
- An Action Node is any subsequent node that performs a task, like sending an email or updating a spreadsheet.
To get a clearer picture of these concepts, let's read a short, focused article that breaks down what nodes are.
Learn n8n #3 — Understanding Nodes in n8n
This article, 'Learn n8n #3 — Understanding Nodes in n8n' by Taufik Kemal, provides excellent, simple definitions for nodes and their different categories.
Please read from the beginning down to the end of the section 'The Three Main Categories of Nodes'. Focus on the definitions of a 'node' and the three categories: Entry Points (Triggers), Functions (Logic Nodes), and Exit Points (Apps / Actions).
As the article explained, we can group nodes into three main types:
- Triggers (Entry Points): These start the workflow (e.g., a schedule, a new email).
- Actions (Exit Points): These interact with external apps to do work (e.g., post to Slack, add a row to Google Sheets).
- Logic Nodes (Functions): These are internal "thinking" nodes that manipulate data or control the workflow's path (e.g., an IF node that creates a conditional path). We will explore these in detail in a later module.
What are Connections?
If nodes are the steps, connections are the lines that link them together. They serve two critical functions:
- They define the sequence: Connections show the order of operations. The workflow follows the path laid out by the connections, executing one node after the other.
- They pass data: This is the most important concept. The output data from one node flows through the connection and becomes the input data for the next node.
For example, if your trigger node is "New email arrives," it outputs data like the sender's address, the subject line, and the email body. A connection carries this data to the next action node, say, a "Create spreadsheet row" node, which can then use the sender's address and subject line to fill in the columns of your sheet.
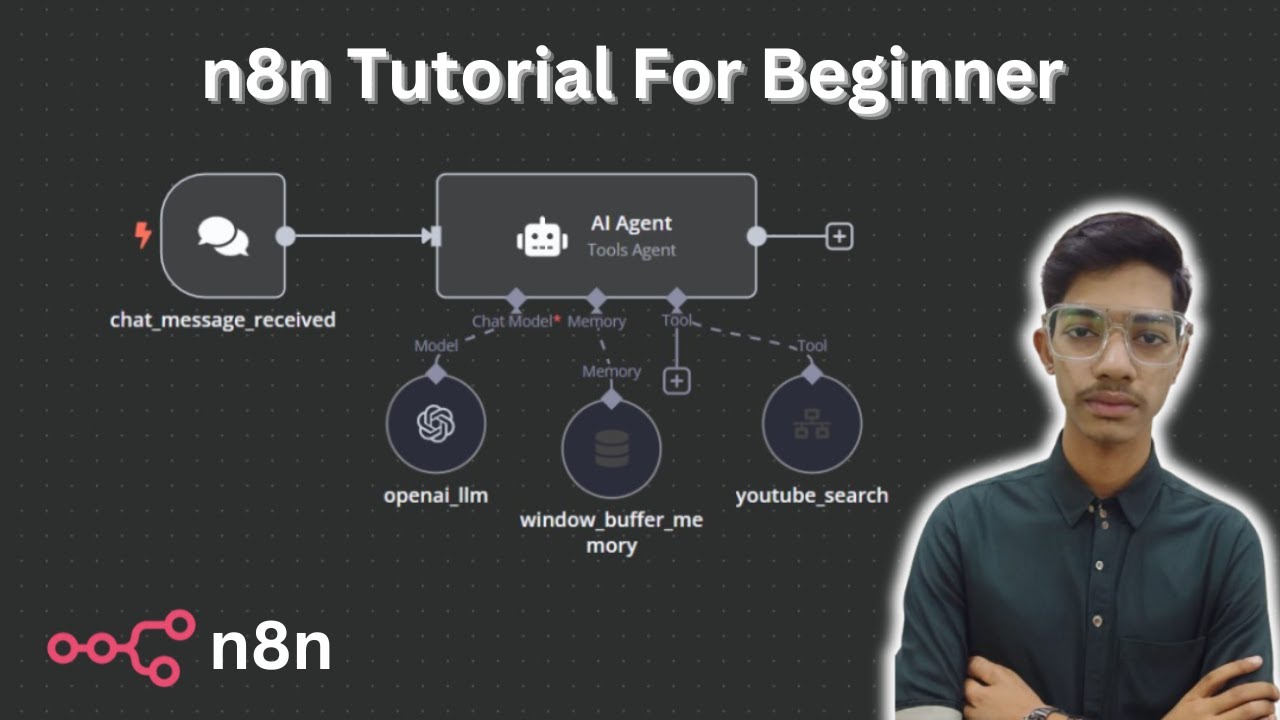
The Workflow Canvas in Action
The area where you build your automation by placing and linking nodes is called the canvas. To see how this all comes together in practice, let's watch a video from n8n, another popular free automation tool.
n8n Beginner Course (3/9) - What are nodes?
This video from the official n8n YouTube channel is part of their beginner course and explains what nodes are and how they are used on the canvas.
First, watch the introduction from 00:00 to 01:00. This will reinforce the concept of nodes as the building blocks of a workflow.
Now that you have the concept down, let's see how you add these nodes to the canvas and connect them to create a flow.
n8n Beginner Course (3/9) - What are nodes?
Continuing with the same video, let's see how to add and connect nodes.
Watch from 01:00 to 02:15. Pay close attention to how the first node added must be a trigger, and subsequent nodes are connected by dragging from the small circle on the right of a node.
Finally, let's focus on how data moves between these connected nodes. The video explains the concepts of "input" and "output" data, which is what the connections carry.
n8n Beginner Course (3/9) - What are nodes?
This next part is crucial. It explains how to see the data that flows into a node and the data that flows out of it.
Watch from 04:12 to 05:36. You'll see the 'Input' and 'Output' tabs in the node's settings. This is how you can check what data a node received and what data it produced after running.
The ability to see the input and output data for every single node is the most important skill for troubleshooting. When something goes wrong, the first thing you'll do is inspect the data at each step to see where things broke down.
Test your understanding!
Let's imagine you want to automate this task: "When I add a new video link to a 'Watch Later' spreadsheet in Google Sheets, I want to get a summary of that video and then send that summary to myself in an email."
Describe how you would represent this workflow using nodes and connections. What is the trigger node? What are the action nodes? How does data flow?
Show answer
- Node 1 (Trigger): A "Google Sheets" trigger node set to "Watch for new rows" in your 'Watch Later' sheet.
- Connection 1: This connection carries the data from the new row (specifically, the video link) from the trigger node to the next action node.
- Node 2 (Action): An "AI" or "Summarize" action node. It takes the video link from its input and produces a text summary as its output.
- Connection 2: This connection carries the text summary from the "Summarize" node to the final action node.
- Node 3 (Action): An "Email" action node. It takes the text summary from its input and uses it to compose and send the email.
Conclusion
Great job today! You've learned the fundamental visual language used by all no-code automation tools.
Key Takeaways:
- Workflows are represented visually on a canvas, similar to a flowchart.
- Nodes are the building blocks that represent individual steps (a trigger or an action).
- Connections are the lines that link nodes. They define the order of execution and, most importantly, pass data from one step to the next.
- Understanding this
Node -> Connection -> Nodestructure and the flow of data is the key to building and debugging automations.
In our next lesson, we will put this knowledge into practice. You'll set up your own free n8n account and take your first tour of the interface, where you'll see the dashboard, credentials area, and the workflow canvas you learned about today.