Welcome back. In our last lesson, you mastered the fundamentals of Kusto Query Language (KQL), learning how to transform raw operational data into actionable insights. You can now interrogate your logs to diagnose issues, analyze performance, and understand system behavior. Today, we take the crucial next step from reactive analysis to proactive monitoring.
Our focus is to design an alerting strategy using Azure Monitor action groups and alert rules for proactive issue detection. For an architect, this is not merely a technical task of configuration; it is a core design activity that directly impacts a system's reliability and operational excellence. We will explore the components of Azure's alerting framework and, more importantly, the strategic principles for using them effectively to build a robust, scalable, and manageable monitoring solution that informs without overwhelming.
The Anatomy of an Alerting Pipeline
At its core, an alerting system is a data processing pipeline. Telemetry flows from your resources, is evaluated against predefined conditions, and triggers a response if those conditions are met. Azure Monitor formalizes this flow into a clear set of components.
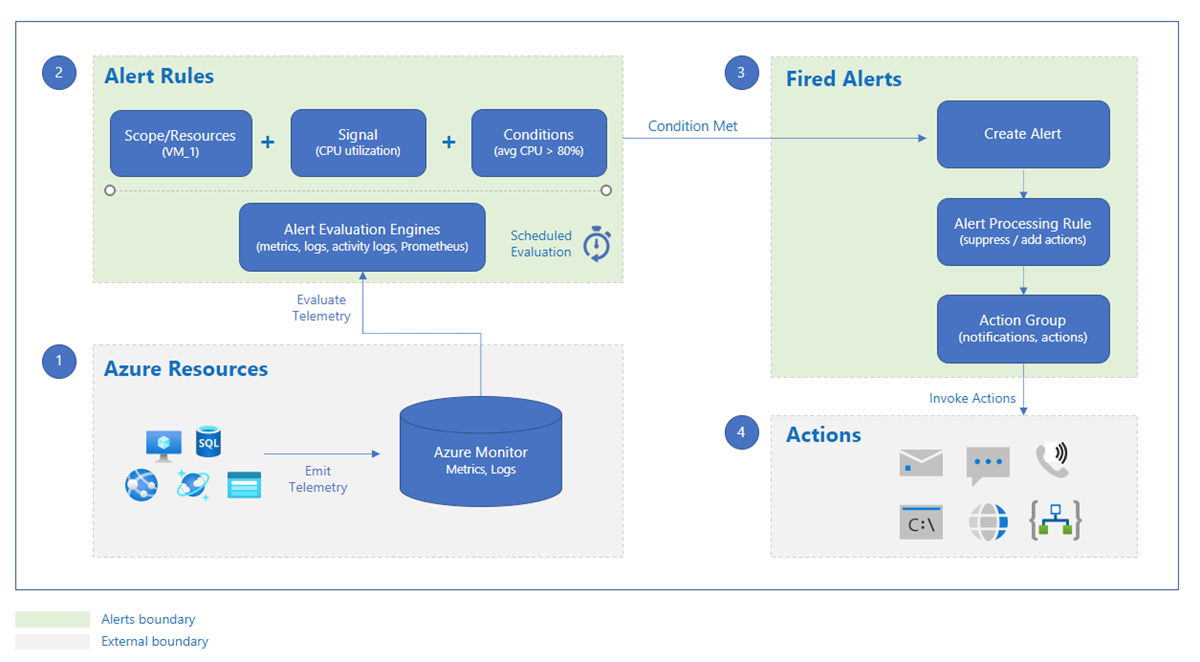
Let's break down this flow from an architectural viewpoint:
- Azure Resources & Telemetry: This is the source data we discussed in previous lessons—metrics (like CPU utilization) and logs (like application exceptions or security events).
- Alert Rules: This is the brain of the operation. An alert rule binds a specific scope (which resources to monitor), a signal (which metric or log to watch), and a condition (the threshold or logic that defines a problem).
- Fired Alerts & Processing: When a rule's condition is met, an "alert instance" is created. This is where Alert Processing Rules come into play, providing a powerful mechanism to manage and route alerts at scale before any action is taken. We will explore this in detail.
- Actions: This is the response. Actions are defined within Action Groups and can range from simple notifications (email, SMS) to sophisticated automation (triggering an Azure Function or a Logic App).
A well-designed strategy involves making deliberate choices at each stage of this pipeline.
The First Decision: Choosing the Right Signal
Your first architectural decision when creating an alert rule is choosing the signal type. Azure Monitor offers two primary types: Metric alerts and Log alerts. Each is optimized for different scenarios, and understanding their trade-offs is crucial for both cost and effectiveness.
Let's expand on this comparison:
Metric Alerts
Metric alerts are built on the time-series metric data we explored earlier. They are best suited for monitoring predictable, numerical values that are emitted regularly.
- Use Cases: Tracking CPU percentage, disk I/O, network traffic, incoming request count, or the length of a message queue. These are your classic infrastructure and performance counters.
- Strengths:
- Performance: They are evaluated very quickly and can operate in near real-time (as frequently as every minute).
- Stateful: They understand state transitions. An alert can fire when a threshold is breached and be automatically resolved when the metric returns to normal.
- Dynamic Thresholds: This is a key advantage. Instead of setting a static value like
> 80%, you can use machine learning to establish a baseline for your resource's normal behavior, alerting on deviations. This is invaluable for resources with cyclical or variable load patterns.
- Limitations: They can only operate on numerical metric data and lack the rich query capabilities of log alerts.
Log Alerts
Log alerts leverage the full power of the KQL queries you learned in the previous lesson. You write a query, and the alert rule runs it on a schedule.
- Use Cases:
- Detecting specific application errors (
where Level == 'Error'). - Alerting on security events (e.g., multiple failed login attempts from a single IP).
- Monitoring for the absence of an event (e.g., no heartbeat received from a critical service in the last 10 minutes).
- Complex business logic (e.g.,
joiningrequestsanddependenciesto find transactions that are slow but not failing).
- Detecting specific application errors (
- Strengths:
- Flexibility: Anything you can express in KQL, you can alert on. This allows for incredibly sophisticated and context-rich conditions that are impossible with metrics alone.
- Limitations:
- Cost and Latency: Log queries are more expensive to run than metric evaluations. The alert frequency is typically lower (e.g., every 5 or 15 minutes) due to query execution and data ingestion latency. The article on best practices for alerts notes that a higher frequency for log search alerts leads to higher costs.
As an architect, your guiding principle should be: Use metric alerts for simple, numerical threshold monitoring. Use log alerts for complex pattern matching, event correlation, and application-specific logic.
Defining the Response: Action Groups
Once an alert fires, something needs to happen. Action Groups are reusable collections of actions that decouple the alert logic from the notification and automation workflow. This is a sound design principle, allowing you to define, for instance, a "Critical-Tier1-SRE" action group once and attach it to dozens of different alert rules.
An action group can contain two categories of actions:
- Notifications: Informing humans. This includes email, SMS, Azure App push notifications, and voice calls. You can target specific email addresses or users with specific Azure RBAC roles (e.g., "all users with the Subscription Owner role").
- Automation: Triggering systems. This is where you can build self-healing and automated remediation. Actions include:
- Webhook: Call any external HTTP endpoint.
- Azure Function: Execute serverless code.
- Logic App: Trigger a complex workflow.
- Automation Runbook: Run a PowerShell or Python script.
- ITSM: Integrate with tools like ServiceNow to create an incident ticket automatically.
The following video provides a practical demonstration of creating an alert rule from a KQL query and linking it to an action group that sends notifications. It's a perfect example of putting our last lesson into practice.
Monitoring and alerting like a pro with Azure Monitor/Application Insights - Stefán Sigurðarson
In this segment from his NDC talk, Stefán Sigurðarson demonstrates creating an alert based on a KQL query that counts exceptions.
Watch the section from creating an alert rule. Pay close attention to how he: Starts from a KQL query in a dashboard. Configures the alert logic (threshold and evaluation frequency). Selects a pre-existing Action Group to define the response. Discusses how different action groups can be used to notify different teams (SREs vs. Developers) based on the alert type.
The ability to trigger automation is fundamental to modern operations. An alert for high CPU on a web server shouldn't just page an engineer; it could trigger an Azure Function that adds another instance to the scale set, mitigating the issue before a human even sees the notification.
Managing Alerts at Scale: Alert Processing Rules
In a small environment, linking alert rules directly to action groups works well. In a large enterprise with thousands of resources and hundreds of alert rules, this approach becomes unmanageable. How do you handle planned maintenance for an entire region? You would have to manually disable every relevant alert rule, which is error-prone and inefficient.
This is the problem that Alert Processing Rules (formerly known as Action Rules) are designed to solve. They act as a global post-processing layer for all fired alerts, allowing you to centrally manage actions and suppressions without modifying individual alert rules.
John Savill provides an exceptionally clear explanation and demonstration of this concept.
Microsoft Azure Monitor - Alert Processing Rules
This video by John Savill is one of the best resources for understanding the power of decoupling actions from alerts using Alert Processing Rules.
Please watch the following segments: First, watch the section covering traditional alerts and action groups from the old model. This sets the stage by showing how an alert rule is typically linked to an action group. Next, focus on the core explanation of Alert Processing Rules. He masterfully explains how they decouple the alert from the action, allowing for management at scale. Finally, observe the demonstration from the practical example, where he creates a rule to apply an action group based on a resource group filter, and then creates another rule to suppress it. This clearly illustrates the power of this feature.
To summarize the key capabilities John Savill demonstrates:
- An Alert Processing Rule defines a scope (e.g., a subscription or resource group) and optional filters (e.g., severity, service, resource type).
- It can then perform one of two functions on any alert that matches its criteria:
- Apply Action Groups: Add a specific action group to the alert. This is how you can implement policies like "All
Sev0alerts in the production subscription must trigger the PagerDuty action group." - Suppress Actions: Prevent any action groups from running. This can be done always or, crucially, on a schedule. This is the solution for planned maintenance windows. You create one rule that says "Suppress all notifications for resources in
EastUSfrom 10 PM to 11 PM on Saturday."
- Apply Action Groups: Add a specific action group to the alert. This is how you can implement policies like "All
Using Alert Processing Rules is a best practice for operational excellence in any significant Azure deployment.
Designing a Holistic Alerting Strategy
Now that we have the building blocks, let's elevate the discussion to strategy. Creating alerts ad-hoc leads to a noisy, unmanageable environment. A principled approach is required. The Azure Well-Architected Framework provides excellent guidance here.
Architecture strategies for designing a reliable monitoring ...
This Microsoft Learn article from the Well-Architected Framework outlines the high-level principles for a reliable monitoring strategy. It's essential reading for thinking like an architect.
Please read the introduction and the main section implementing the strategy. Focus on the recommended design principles, not just the list of Azure services.
Synthesizing from that article and industry best practices, here is a framework for your alerting strategy:
-
Start with a Health Model: Before writing a single alert rule, define what "healthy," "degraded," and "unhealthy" mean for your critical user flows. Your primary alerts should trigger on transitions between these states. For example, a "degraded" state might be an average API response time exceeding 500ms, while "unhealthy" is an error rate above 5%.
-
Alert on Symptoms, Not Causes: Page a human when the user is impacted (symptom), not just because a server is busy (cause).
- Symptom: High API error rate, slow page load times, failed transactions. These are often best captured with Log Alerts on Application Insights data.
- Cause: High CPU, low memory, long disk queue. These are good candidates for Metric Alerts, but they should trigger lower-severity alerts or automated scaling actions, not wake someone up at 3 AM unless they are a confirmed leading indicator of an imminent symptom.
-
Establish a Clear Severity Hierarchy: Not all alerts are equal. Define a handful of severity levels with explicit response expectations. For example:
- Sev-0 (Critical): Automated paging, human response required within 5 minutes. Represents a critical outage.
- Sev-1 (Error): Automated ticket creation in ITSM, team notification in a chat channel. Human response required within business hours. Represents a significant degradation.
- Sev-2 (Warning): Logged for analysis, may trigger automated remediation. No human response required. Represents a potential issue or deviation from baseline.
-
Implement Defense in Depth: Monitor every layer of your stack.
- Azure Platform: Create Service Health and Resource Health alerts. These are free and will notify you of Azure-level problems impacting your resources. This is a non-negotiable first step.
- Infrastructure: Use metric alerts with dynamic thresholds for key resource metrics (CPU, memory, network, etc.).
- Application: Use log alerts on Application Insights data for exceptions, dependency failures, and distributed traces.
- Business: Instrument your application with custom telemetry to monitor key business KPIs (e.g., orders per hour, payment failures) and create log alerts for them.
-
Automate and Refine: Manage your alert rules and action groups as code using Bicep or Terraform. This ensures consistency and governance. Use data from incidents to continuously tune your alerts—remove noisy ones that don't provide value and add new ones that would have caught an issue earlier.
Conclusion
In this lesson, we have moved beyond simple data querying to the architectural design of a proactive monitoring strategy. You've learned how to leverage Azure Monitor's components to build a system that can detect issues, notify the right people, and even trigger automated remediation.
Key Takeaways:
- An alerting pipeline consists of signals (metrics, logs), Alert Rules, Action Groups, and Alert Processing Rules.
- Metric alerts are ideal for simple, real-time thresholding on numerical data, while Log alerts provide ultimate flexibility through KQL for complex pattern detection.
- Action Groups decouple alert logic from the response, enabling reusable notification and automation workflows.
- Alert Processing Rules are essential for managing alerts at scale, allowing for centralized suppression (e.g., for maintenance) and routing.
- A successful strategy is built on principles: start with a health model, alert on symptoms, establish a severity hierarchy, and continuously refine.
You now have the conceptual framework to design a monitoring system that supports a reliable, high-performing application on Azure. In our next lesson, we will focus on the human interface to this system by learning how to compare Azure Dashboards and Workbooks for creating operational visibility and interactive reports.