Welcome back. In our previous lesson, we established a framework for proactive monitoring by designing an alerting strategy. You learned how to translate system signals into actionable alerts using Azure Monitor's rules and action groups. Now that we can automatically detect issues, the next logical step is to create the human interface for our monitoring data—the visual tools that provide operational visibility and support investigation.
This lesson directly addresses the learning outcome: to compare Azure Dashboards and Workbooks for creating operational visibility and interactive reports. As an architect, selecting the right visualization tool is not a trivial choice. It's about designing an information system that serves specific audiences—from an on-call engineer needing a quick status check to a business leader reviewing monthly performance. We will dissect the capabilities and architectural trade-offs of each tool to build a clear decision framework for their use.
The Purpose of Visualization
Before we compare the tools, let's establish why we visualize data in the first place. A stream of raw logs or metrics is overwhelming. Visualization is the process of converting this complex telemetry into actionable insights. Effective visualization is a design discipline in itself.
The Azure Well-Architected Framework provides excellent guidance on this topic. A poorly designed dashboard can be worse than no dashboard at all, creating noise and confusion.
This document from the Well-Architected Framework outlines best practices for the visualization phase of a monitoring system. It also discusses common antipatterns to avoid.
Please read the introduction to Phase 4 - Visualization, focusing on the best practices. Then, in the "Monitoring antipatterns" section, pay close attention to the row discussing poorly designed dashboards. These principles form the criteria by which we can judge our two tools.
As the reading highlights, a good visualization strategy should:
- Align with a health model: Clearly indicate if a system is healthy, degraded, or unhealthy.
- Prioritize actionable data: Focus on what matters and what requires a decision.
- Support interactive exploration: Allow users to drill down and investigate anomalies.
- Be tailored to the audience: Developers, operators, and business stakeholders have different needs.
With these principles in mind, let's examine Azure's two primary tools for this purpose: Azure Dashboards and Azure Workbooks.
Azure Dashboards: The Shared Pane of Glass
Azure Dashboards are the most straightforward way to create a centralized view of your Azure resources and monitoring data. Think of a dashboard as a personal or shared "pane of glass" that aggregates key information in one place.

The core concept of a dashboard is a grid of tiles. Each tile displays a specific piece of information. You can create these tiles by "pinning" them from almost anywhere in the Azure portal:
- A metric chart from a VM's Monitoring blade.
- The result of an Azure Resource Graph query.
- A summary tile showing the count of resources in a resource group.
- Static text or markdown for instructions.
The following video provides an excellent overview of how to create, customize, and share dashboards.
In this video, "Talking tech with Techielass" walks through the fundamentals of Azure Dashboards, from creation to sharing and automation.
Please watch the following segments to understand the key features: What are dashboards? - A high-level introduction. Creating and editing - See how a dashboard is built from a template and how tiles are configured. Notice that clicking a tile often leads to the Azure Resource Graph Explorer. Pinning queries - This demonstrates the common workflow of writing a KQL query in Resource Graph and pinning the result to a dashboard. Sharing and RBAC - Pay close attention to this part. A shared dashboard becomes an Azure resource in a resource group, with access managed by standard Azure RBAC. This is a key architectural point. Importing, exporting, and automation - The video shows how dashboards are defined by JSON, which enables import/export and programmatic deployment via tools like Terraform.
Key Architectural Characteristics of Dashboards:
- Simplicity: Easy to create and modify by pinning existing visualizations.
- Static Nature: Dashboards are primarily for display. While some tiles have basic filtering, they lack deep interactivity or dynamic parameters that affect the entire dashboard.
- Resource-Centric Sharing: A shared dashboard is an Azure resource. This is both a strength (managed by standard RBAC, tags, etc.) and a limitation (it exists within a specific subscription and resource group).
- Governance: Because they are JSON-based resources, they can be version-controlled and deployed via Infrastructure as Code (IaC), which aligns with DevOps best practices.
Dashboards are excellent for creating simple, high-level status boards—for example, a Network Operations Center (NOC) screen or a personal "start page" for daily checks. However, for deep, interactive analysis, we need a more powerful tool.
Azure Workbooks: Interactive, Narrative-Driven Reports
If Dashboards are a static pane of glass, Azure Workbooks are dynamic, interactive documents. They allow you to combine text, queries, metrics, and parameters to create rich, narrative-driven reports that guide a user through an investigation or data exploration.
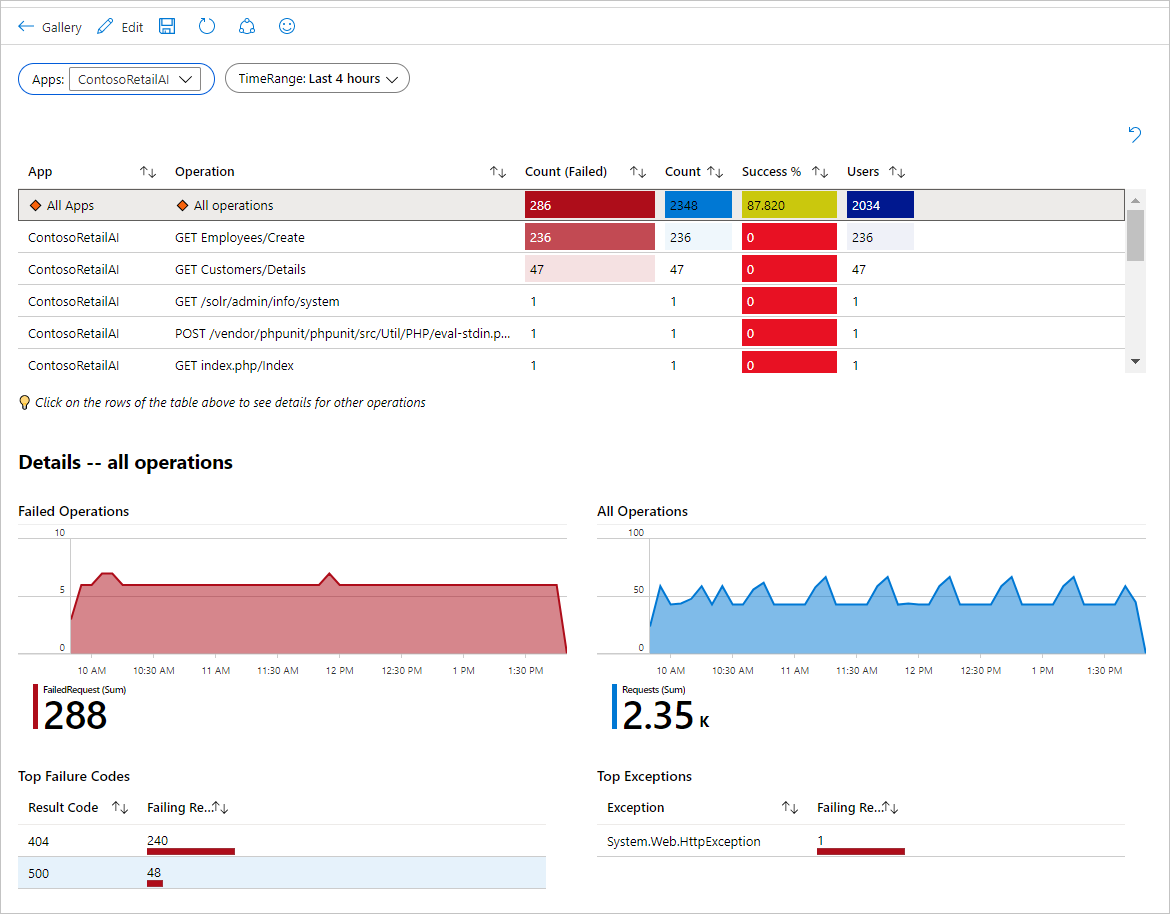
Workbooks overcome many of the limitations of Dashboards. A community blog post on modernizing an Azure Inventory workbook provides an exceptionally clear comparison.
Azure Monitoring Dashboard: Modernize Workbooks (50→200+ ...
This blog post provides a practical look at the power of Azure Workbooks, contrasting them with Dashboards and demonstrating advanced features.
Your reading focus should be on these sections: First, carefully study the comparison table. This is a concise summary of the key differences. Next, read the sections on Key Technical Enhancements and New Functional Capabilities. These sections provide concrete examples of advanced Workbook features like conditional visibility, global filtering, portal integration, and security monitoring logic embedded directly in the report. Finally, review the Technical Lessons Learned section for insights on parameter management and KQL performance, which are important design considerations.
The comparison table from the article nails the key differences, but the real power of Workbooks is best understood through demonstration. The features described—like conditional visibility, global filters, and integrating multiple data sources—are what elevate Workbooks from a simple dashboard to an interactive analysis tool.
This next video demonstrates some of these powerful features in action.
Mastering Azure Monitor: Essential Tips in 15 Minutes | DEM537
In this "Mastering Azure Monitor" talk from Microsoft Developer, the speaker shows how Workbooks can transform raw KQL query results into rich, interactive visualizations.
Watch these key demonstrations of Workbook capabilities: Visual Enhancements: See how a basic table is enhanced with conditional icons for status and data bars for percentages. This is a level of formatting unavailable in Dashboards. Smart Formatting and Links: This part is crucial. Observe how raw byte values are converted into human-readable formats (GB, TB) and, most importantly, how a resource ID is automatically turned into a clickable link that navigates directly to that resource in the Azure portal. This is a massive productivity boost for troubleshooting. Multiple Data Sources: This highlights a key architectural advantage. The speaker shows how a single workbook can query data from Log Analytics workspaces across multiple subscriptions or even query the entire tenant using Azure Resource Graph. Interactive Parameters: This clip shows how dropdown parameters can be used to dynamically filter the entire report, creating a truly interactive experience for the end-user.
Key Architectural Characteristics of Workbooks:
- Interactivity: Parameters are a first-class citizen, allowing users to filter, scope, and change the context of the entire report.
- Multiple Data Sources: A single workbook can combine data from Azure Monitor Logs (across workspaces/subscriptions), Metrics, Azure Resource Graph, and even external JSON endpoints.
- Rich Presentation: Offers a narrative flow with markdown text, advanced formatting, conditional visibility, and complex layouts like tabs and master-detail views.
- Template-Driven: Workbooks can be saved as templates, allowing for standardization of reports (e.g., a standard "Cost Report" or "Security Compliance" workbook) across an organization.
The Decision Framework: Dashboards vs. Workbooks
So, when should you, as an architect, recommend a Dashboard versus a Workbook? The choice depends on the audience, the required interactivity, and the complexity of the data.
| Feature / Use Case | Azure Dashboards | Azure Workbooks |
|---|---|---|
| Primary Goal | At-a-glance status monitoring | Interactive reporting & guided investigation |
| Layout | Static grid of tiles | Freeform document with tabs, sections, and text |
| Interactivity | Low (basic tile-level filtering) | High (global parameters, drill-down, conditional logic) |
| Data Sources | Typically single-source per tile (e.g., one query) | Multi-source (Logs, Metrics, ARG, JSON) in one report |
| Audience | On-call engineers, operators (NOC screens) | SREs, developers, security analysts, cost managers |
| Typical Use | "Is anything broken right now?" | "Why is it broken?" or "Show me the trend of X." |
| Example | A board showing live CPU/Memory of critical VMs | A report to analyze application failures, filtered by error code and time range, with links to distributed traces. |
| Effort to Create | Low (pinning existing charts) | Medium to High (requires KQL and report design) |
Guiding principle:
- Use Azure Dashboards for simple, static, high-level operational views. If your goal is to quickly assemble a "wallboard" from existing metrics and queries, a Dashboard is the right tool.
- Use Azure Workbooks when you need to tell a story with data. If you are creating a report that requires user input, combines multiple data sets, or guides a user through a troubleshooting or analysis process, a Workbook is the superior choice.
Conclusion
In this lesson, we have compared the two primary tools for operational visibility in Azure. You have learned that while both can display charts and metrics, they are designed for fundamentally different purposes.
Key Takeaways:
- Azure Dashboards provide a simple, static grid of tiles, ideal for at-a-glance status monitoring. They are easy to create by pinning visuals from around the portal and are managed as standard Azure resources.
- Azure Workbooks are powerful, interactive reporting tools. They enable you to combine multiple data sources, use dynamic parameters, and create narrative-driven reports for deep analysis and guided troubleshooting.
- The architectural choice is driven by the use case: Dashboards answer "what is the status?", while Workbooks answer "why is this the status?".
You are now equipped to design visualization strategies that provide genuine insight, not just data. This completes our module on Monitoring and Observability.
In our next lesson, we will pivot to the critical domain of security. We will begin the "Security Architecture and Compliance" module by learning to evaluate architectural patterns for integrating Azure Key Vault to manage secrets, keys, and certificates securely.