Introduction
Welcome to the first lesson of our new module, "Technical Analysis and Behavioral Finance."
Over the past several modules, you have built a strong foundation in fundamental analysis. We've focused on dissecting a company's financial health, competitive position, and management quality to determine its intrinsic value. You learned to read financial statements, calculate key ratios, and even build a full Discounted Cash Flow (DCF) model to estimate what a stock should be worth. This entire approach is about understanding the underlying business.
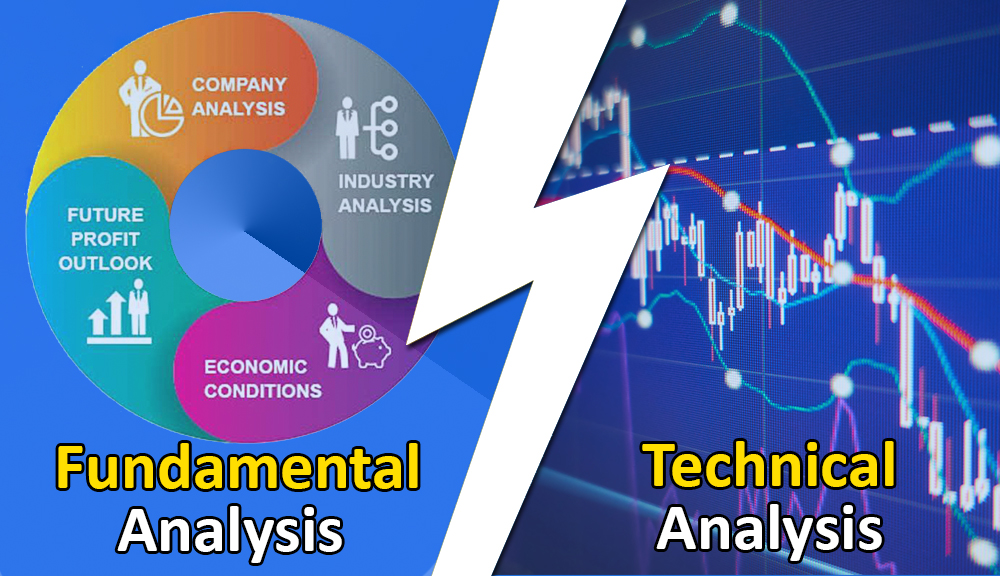
Now, we are going to pivot to a completely different school of thought. Today's lesson will introduce you to technical analysis, a method that largely ignores a company's fundamentals and instead focuses on its stock price and trading data. Our goal is to explain the purpose of technical analysis and how it differs from fundamental analysis. By the end of this lesson, you will understand the core philosophies, tools, and goals that distinguish these two major approaches to stock market analysis.
Two Philosophies: The Detective vs. The Crowd Watcher
To begin, let's frame the difference between fundamental and technical analysis with a helpful analogy. Imagine you're trying to find the best food stall in a busy market in a foreign country.
- The Fundamental Approach: You could go to each stall, inspect the ingredients, ask the chef about their cooking process, and maybe even taste a small sample. This is deep, investigative research, much like a fundamental analyst who studies a company's financial reports and business strategy.
- The Technical Approach: Alternatively, you could stand back and observe the crowd. You would look for the stall with the longest, most consistent queue, assuming that the crowd's collective wisdom has already identified the best food. This is like a technical analyst who studies market activity (price and volume), assuming that all information is already reflected in the crowd's behavior.
The following video from Zerodha Varsity expands on this idea and introduces the core principles of technical analysis.
1. Fundamental analysis vs technical analysis
This video provides an excellent analogy to differentiate between fundamental and technical analysis, and then defines technical analysis and its key underlying assumptions.
Please watch from 01:50 to 05:04. The first part (until 04:07) explains the food stall analogy. The second part defines technical analysis and lists its core assumptions.
As the video explained, technical analysis operates on a few key assumptions:
- Markets discount everything: All known information—from earnings reports to economic news and investor sentiment—is already factored into the stock's current price. Therefore, there's no need to study these factors separately.
- "How" is more important than "Why": A technical analyst is less concerned with why a price is moving and more concerned with the fact that it is moving. The focus is on the price action itself.
- Price moves in trends: Technicians believe that prices tend to follow trends (up, down, or sideways) and that these trends are likely to continue until a clear reversal occurs.
- History tends to repeat itself: Market participants tend to react to similar situations in predictable ways. This leads to recurring chart patterns that can be used to forecast future price movements.
A Structured Comparison
Now that you have a conceptual understanding, let's break down the differences in a more structured way. While fundamental analysis asks, "What is this company's true value?", technical analysis asks, "Where is the price likely to go next based on market psychology?"
The following article clearly defines both methods and presents their differences in a simple table.
Technical vs Fundamental Analysis: Which One Should You Use?
To solidify your understanding, please read the following article from Gotrade. It provides clear definitions and a direct comparison of the two methods.
Read from the beginning of the article down to the end of the section 'Key Differences Between Technical and Fundamental Analysis'. Pay close attention to the table that contrasts the goal, focus, time horizon, and tools of each method.
Let's summarize the key distinctions from that article's table:
| Aspect | Fundamental Analysis (FA) | Technical Analysis (TA) |
|---|---|---|
| Goal | Determine a company's intrinsic value. | Predict future price movements. |
| Focus | Financial statements, economic data, company quality. | Historical price and volume data. |
| Time Horizon | Long-term (months to years). | Short to medium-term (days to months). |
| Tools Used | Financial ratios (P/E, ROE), DCF models, economic reports. | Charts, indicators (Moving Averages, RSI), and patterns. |
| Key Question | Is this company a good business to own? | What is the market sentiment for this stock? |
Combining the Two: "What to Buy" vs. "When to Buy"
It's tempting to ask which method is "better," but as you saw in the resources, this is the wrong question. They are not mutually exclusive; they are different tools for different jobs, and many successful investors use a combination of both.
A popular and effective way to integrate them is summarized by this simple mantra:
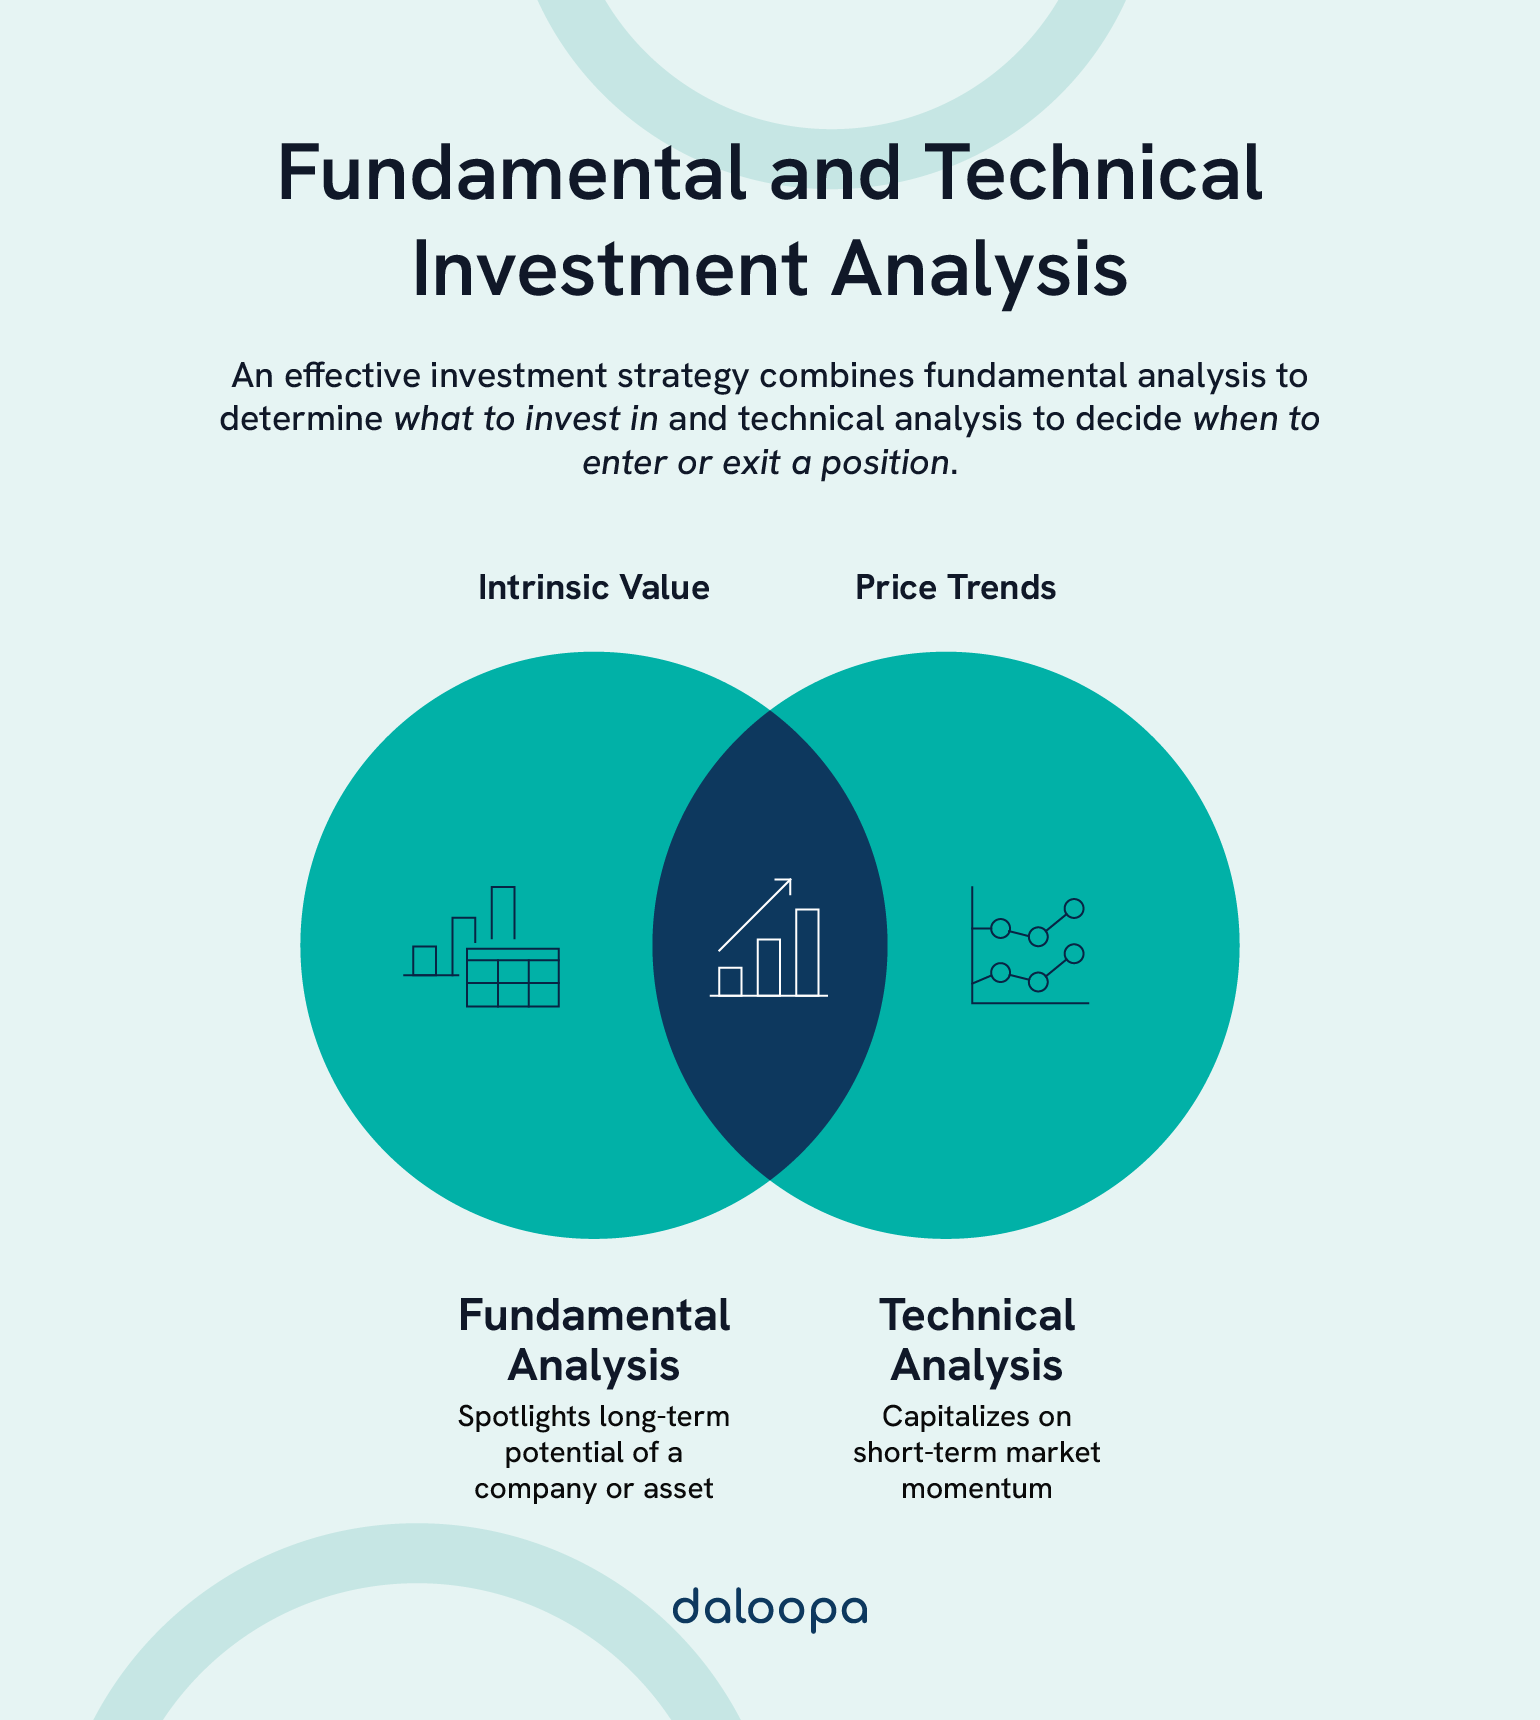
Fundamental analysis tells you what to buy, while technical analysis tells you when to buy.
An investor might use fundamental analysis to create a watchlist of financially strong companies that are trading at a reasonable valuation. Then, they might use technical analysis to identify a good entry point for one of those stocks—for example, waiting for the price to find a bottom or break out of a consolidation pattern—before making a purchase. This approach combines the conviction of owning a good business with the tactical advantage of timing.
Conclusion
In this lesson, we have introduced a major new pillar of market analysis. You've transitioned from the "detective work" of fundamental analysis to the "crowd watching" of technical analysis.
Key Takeaways:
- Fundamental Analysis (FA) seeks to determine a stock's intrinsic value by examining business and economic factors. Its goal is to find good companies for long-term investment.
- Technical Analysis (TA) seeks to forecast future price movements by analyzing historical price and volume data. It assumes all information is already reflected in the price and focuses on identifying trends and patterns driven by market psychology.
- The core difference can be summarized as value (FA) vs. price (TA), or long-term (FA) vs. short-term (TA).
- The two approaches can be used together to enhance investment decision-making: FA to select the stock, and TA to time the trade.
Preview of the Next Lesson:
Having established the "what" and "why" of technical analysis, our next step is to learn the "how." In the next lesson, we will begin exploring the primary tool of the technical analyst: the stock chart. You will learn to read and interpret basic stock price charts, including support, resistance, and trend lines.