Introduction
Hello! In our previous lesson, you successfully brought all the pieces of the Discounted Cash Flow (DCF) model together to calculate a single intrinsic value per share for a company. This final number represents your best estimate of a stock's true worth based on a specific set of assumptions about its future performance.
However, the future is uncertain, and our DCF model is built on educated guesses—for the discount rate (WACC), the perpetual growth rate (g), and future cash flows. A minor tweak to any of these assumptions can lead to a significantly different valuation. Relying on a single output from a model with uncertain inputs is risky.
This lesson addresses that very issue. We will explore how to move from a single point estimate to a more realistic range of potential values. Today, you will learn to perform a sensitivity analysis on a DCF model to understand the impact of key assumptions. This is the final and crucial step in building a robust valuation, allowing you to appreciate the full spectrum of possible outcomes for your investment thesis.
Why is Sensitivity Analysis Necessary?
A DCF model is a powerful tool, but its output is only as reliable as its inputs. As you saw in the terminal value calculation, the formula is highly sensitive to the WACC and the terminal growth rate (g).
Small changes in WACC or g can cause large swings in the Terminal Value, which in turn dramatically affects the final intrinsic value. Sensitivity analysis helps us quantify this impact.
DCF – Sensitizing for Key Variables
To understand the importance of this process, let's start with a brief article from Financial Edge that explains the need for sensitizing DCF models.
Please read the first few sections of the article, from the beginning down to just before 'Data Tables: Common Pitfalls'. Focus on why DCF valuation is so dependent on key assumptions and how sensitivity analysis provides a necessary valuation range.
As the article highlights, performing a sensitivity analysis achieves three key objectives:
- Quantifies Risk: It shows you how much your valuation could change if your assumptions are slightly wrong.
- Identifies Key Drivers: It reveals which assumptions have the biggest impact on the final value. This tells you where to focus your research efforts.
- Provides a Valuation Range: Instead of a single price target, you get a range (e.g., a bull, base, and bear case), which is far more useful for making investment decisions.
How to Perform a Sensitivity Analysis in Excel
Given your background in IT and data analysis, the practical application of sensitivity analysis using Excel's built-in tools should feel quite intuitive. The most common method is creating a two-variable data table. This allows you to see how your output (e.g., intrinsic value per share) changes as two key inputs (e.g., WACC and terminal growth rate) vary simultaneously.
The following video demonstrates exactly how to build this table.
Build A Full Discounted Cash Flow Model for a REAL Company
Let's watch a segment from the 'Build A Full Discounted Cash Flow Model' video by Kenji Explains. This clip picks up where a full DCF model has been built and shows the final step of creating a sensitivity table.
Watch the segment from 26:31 to 28:33. The video shows how to build a data table to see how the implied share price changes with different WACC and perpetual growth rate assumptions. Pay close attention to the use of Excel's 'What-If Analysis' -> 'Data Table' feature.
Step-by-Step Guide to Creating a Two-Variable Data Table
Let's break down the process you just saw in the video:
-
Set up the Table Structure:
- Choose a blank area in your spreadsheet.
- In the top-left corner cell of your table, enter a formula that links to your final output, for example,
=Intrinsic_Value_Per_Share_Cell. - Across the top row of the table, enter a range of values for your first variable (e.g., perpetual growth rate: 1.5%, 2.0%, 2.5%, 3.0%).
- Down the first column of the table, enter a range of values for your second variable (e.g., WACC: 8%, 9%, 10%, 11%).
-
Use the Data Table Tool:
- Select the entire table, including the linked output cell and the row/column headers with your variable ranges.
- In Excel, go to the Data tab -> What-If Analysis -> Data Table...
-
Link the Input Cells:
- A dialog box will appear with two fields: "Row input cell" and "Column input cell".
- Row input cell: Click in this box, then select the original cell in your DCF model where the assumption for your top row is located (e.g., the cell for the perpetual growth rate).
- Column input cell: Click in this box, then select the original cell in your model for your left-column assumption (e.g., the cell for WACC).
-
Generate the Analysis:
- Click OK. Excel will automatically populate the table with the different intrinsic values based on each combination of your two variables.
The result is a valuation matrix, like the one shown below.

For a detailed text-and-screenshot walkthrough, the following article is an excellent resource. It also cleverly demonstrates how you can create a three-variable analysis by simply building three separate two-variable tables.
Making a 3-variable DCF Sensitivity Analysis in Excel
This article from 'eInvestingForBeginners' provides a clear, step-by-step guide on creating these tables in Excel. It's a great reference to solidify your understanding.
Read through the article, paying special attention to the section '2-Variable Sensitivity Analysis Table in Excel'. Follow the screenshots to see how the data table function is configured. Notice how the author checks their work by ensuring the center of the table matches the original DCF output.
Advanced Visualization: The Tornado Chart
While a data table is great for seeing the interaction between two variables, what if you want to compare the relative impact of several different assumptions? This is where a Tornado Chart is incredibly useful.
A tornado chart visually ranks the sensitivity of your output to changes in different input variables, from most impactful to least impactful. It immediately tells you which assumptions are the "key drivers" of your valuation.
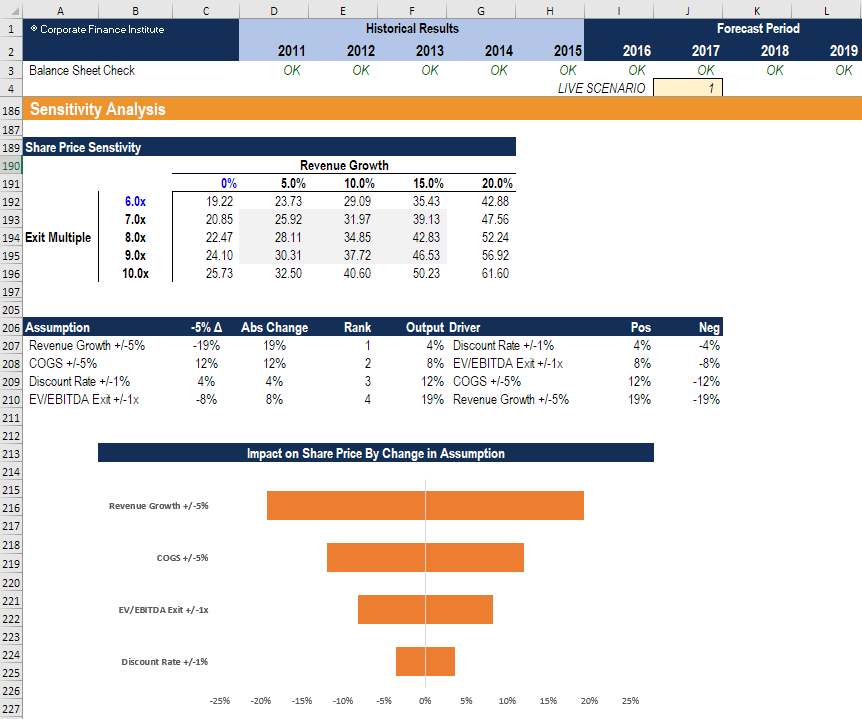
Creating a tornado chart requires a bit more setup in Excel, involving what is sometimes called a "gravity sort table." Given your experience with data visualization tools like Tableau and Power BI, you may find this technique for presenting complex model outputs particularly interesting.
Sensitivity Analysis for Financial Modeling
The following video from the Corporate Finance Institute offers a professional guide to sensitivity analysis, including how to build and interpret a tornado chart.
Watch the segment from 19:32 to 30:02. The video covers: How to analyze results (19:32): Introduces the concept of a 'gravity sort table' to rank sensitivities. Building the gravity sort table (21:23): A step-by-step guide to setting up the data needed for the chart. Creating the tornado chart (26:46): Shows how to build the chart itself and how to interpret it to identify the most impactful model drivers.
Conclusion
You have now reached the end of our deep dive into Discounted Cash Flow valuation. By moving beyond a single-point estimate and embracing sensitivity analysis, you have learned to build a more dynamic, robust, and realistic valuation model.
Key Takeaways:
- A DCF model's output is highly sensitive to its input assumptions, especially the WACC and terminal growth rate.
- Sensitivity analysis is the process of varying these inputs to understand their impact on the final valuation, providing a range of possible outcomes.
- Excel's Data Table feature is the primary tool for creating a two-variable sensitivity matrix, showing how the intrinsic value changes with different combinations of assumptions.
- Tornado charts are an effective way to visually compare the relative impact of multiple different assumptions, helping you identify the most critical drivers of value.
Ultimately, sensitivity analysis forces you to think critically about your assumptions and acknowledge the inherent uncertainty in forecasting. It transforms your DCF from a black box that spits out a single "answer" into a powerful tool for exploring possibilities.
Preview of the Next Module:
With this lesson, we conclude our study of fundamental analysis and intrinsic value. We have focused entirely on a company's business performance and financials to determine what it should be worth.
In the next module, "Technical Analysis and Behavioral Finance," we will shift our perspective entirely. We will leave behind financial statements and instead focus on stock charts, price patterns, and trading volumes. You will learn about the forces of market psychology and how to analyze price trends to inform your buying and selling decisions. This will add another powerful, though very different, set of tools to your investor toolkit.