Introduction
Hello! In our last lesson, we built a forecast of a company's future Free Cash Flow to the Firm (FCFF) for a specific period, typically 5 to 10 years. This was a crucial step, as a company's value is derived from the cash it's expected to generate in the future.
However, a healthy company doesn't simply cease to exist after year 5 or 10. It continues to generate cash indefinitely. Our forecast only covers a fraction of its life. This leaves us with two key questions:
- How do we estimate the value of all the cash flows a company will generate after our detailed forecast period?
- How do we translate all these future cash flows—both from our forecast period and beyond—into a single value today?
This lesson provides the answers and completes our Discounted Cash Flow (DCF) model. You will learn to calculate the intrinsic value of a company by discounting projected FCFF and a terminal value. We will bring together all the components we've learned—FCFF, discount rate, and future growth—into a final, coherent valuation.
Step 1: Calculating the Terminal Value
The value of a company's cash flows beyond the explicit forecast period is called the Terminal Value (TV). It represents the value of the business as a mature, steady-state entity. This single number often accounts for a very large portion (sometimes over 70%) of a company's total DCF value, so understanding its calculation is critical.
There are two primary methods for calculating Terminal Value. The following video introduces both.
Discounted Cash Flow | DCF Model Step by Step Guide
This video from the Kenji Explains channel provides a clear explanation of Terminal Value and the two main ways to calculate it: the Perpetuity Growth Method and the Exit Multiple Method.
Please watch the segment from 09:36 to 12:09. As you watch, focus on understanding the core idea behind each method: Perpetuity Growth: What are the key inputs (final year's FCF, growth rate 'g', discount rate 'WACC') and why must 'g' be a low, stable number? Exit Multiple: What financial metric (e.g., EBITDA) and multiple are used, and where does this multiple typically come from?
Let's formalize the two methods you just saw.
1. Perpetuity Growth Method (Gordon Growth Model)
This method assumes the company's free cash flows will grow at a slow, stable rate (g) forever. This growth rate is typically linked to the long-term growth rate of the economy (e.g., the expected GDP growth or inflation rate).
The formula is:
Where:
- is the free cash flow in the final year of your explicit forecast period (e.g., year 5 or 10).
- is the perpetual (or terminal) growth rate.
- is the Weighted Average Cost of Capital, our discount rate.
A critical rule here is that must be less than . If the growth rate were higher than the discount rate, the formula would imply the company is infinitely valuable, which is not possible.
2. Exit Multiple Method
This method assumes the company is "sold" at the end of the forecast period for a multiple of a key financial metric, such as EBITDA. The multiple is usually based on what similar mature companies are trading at in the market.
The formula is:
Where:
- is the Earnings Before Interest, Taxes, Depreciation, and Amortization in the final year of the forecast.
- The is typically an EV/EBITDA multiple.
As you can see in the image below, analysts often calculate the TV using both methods to see if they produce similar results. A large divergence might suggest an assumption is unrealistic.

Step 2: Discounting All Future Cash Flows
Now that we have our projected FCFFs for years 1 to and a Terminal Value representing all years after , we need to bring them all back to their value in today's terms. This process is called discounting, and it uses the WACC as the discount rate.
The formula for the discount factor for any given year is:
We apply this to each projected FCFF:
Since the Terminal Value is a value calculated at the end of year , it must also be discounted back to the present using the discount factor for year :
The following video segment demonstrates this discounting process and the subsequent summation to calculate the Enterprise Value.
Discounted Cash Flow | DCF Model Step by Step Guide
Let's return to the Kenji Explains video to see how the projected cash flows and the terminal value are discounted and then summed up.
Watch the segment from 12:09 to 13:44. Notice how a discount factor is calculated for each year and then multiplied by that year's cash flow to find its present value. Pay close attention to the final step where all these present values (including the PV of the Terminal Value) are added together.
Step 3: From Enterprise Value to Intrinsic Value Per Share
The sum of the present values of all projected FCFFs and the present value of the Terminal Value gives us the company's Enterprise Value (EV).
Enterprise Value represents the total value of the company's core operations, attributable to all capital providers (both debt and equity holders). However, as stock investors, we are interested in the value belonging only to equity shareholders.
To get from EV to Equity Value, we must adjust for debt and cash:
Think of it this way: if you were to buy the entire company (EV), you would also acquire its debts (which you'd have to pay off) and its cash (which you'd get to keep).
Finally, to find the Intrinsic Value per Share, we divide the Equity Value by the number of shares outstanding.
This final number is our estimate of what one share of the company is truly worth. We can then compare it to the current market price to decide if the stock is potentially undervalued, fairly valued, or overvalued.
This next video provides an excellent walkthrough of this entire final sequence.
How to perform a Discounted Cash Flow Model Step by Step! (Intrinsic Value for Beginners)
This video from Dividendology clearly demonstrates the final steps: summing the present values, adjusting for cash and debt to find the Equity Value, and calculating the price per share.
Watch the segments from 07:06 to 11:25. The first part (07:06 - 08:23) quickly recaps the discounting process. The second, more critical part (08:23 - 11:25) shows exactly how to: Sum the present values of the cash flows. Find the company's cash and debt from its financials. Calculate the Equity Value. Find the shares outstanding and calculate the final intrinsic value per share.
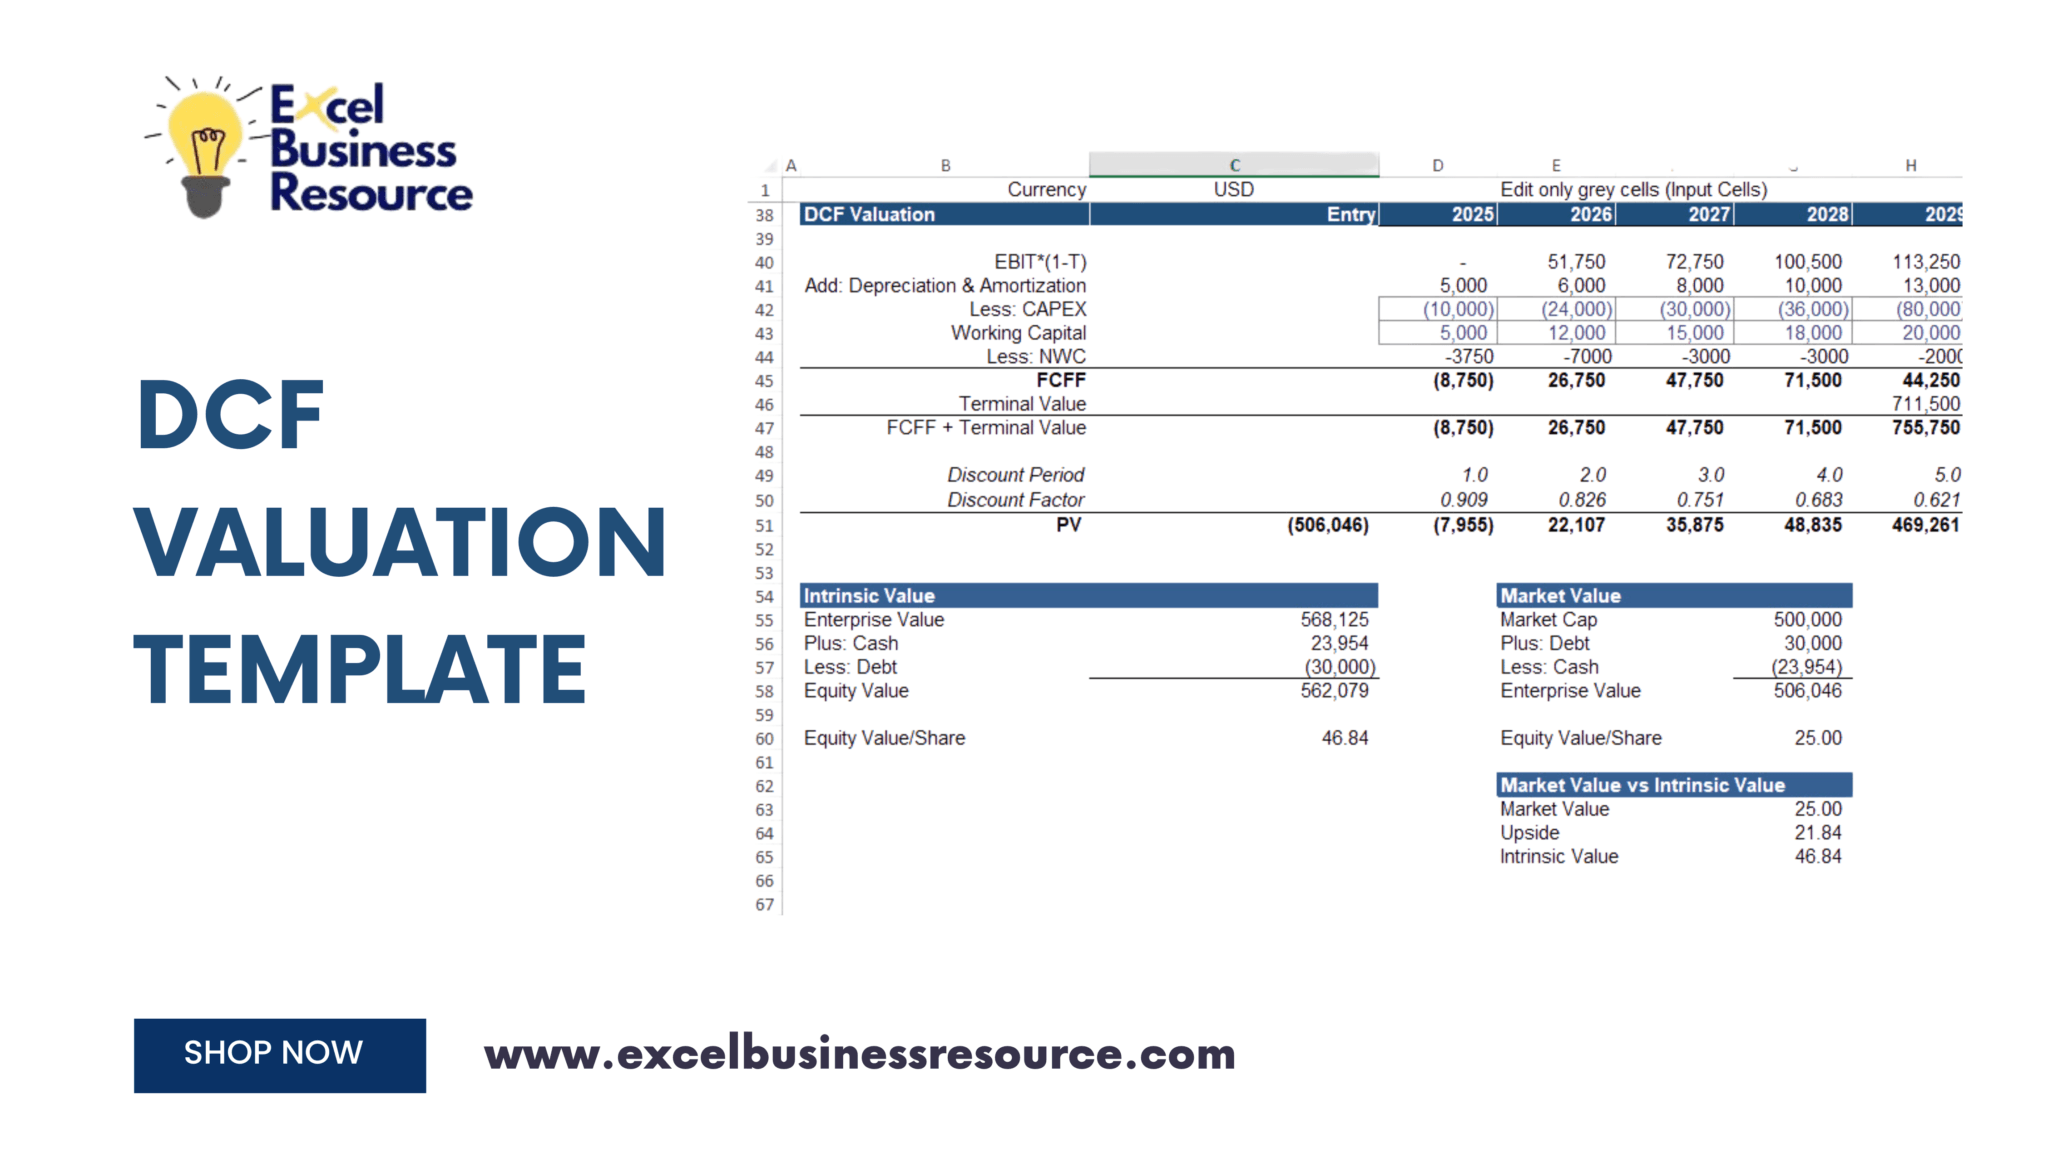
The entire process we've just covered is summarized in financial models like the one below. Given your experience with structured data systems, you can see how each part logically flows into the next to produce the final output.
A Real-World Example from the Colombo Stock Exchange (CSE)
Theory is valuable, but seeing it applied in the real world—especially in your target market—makes it concrete. The prospectus for the Initial Public Offering (IPO) of Maharaja Foods Limited provides a perfect, professionally prepared DCF valuation for a Sri Lankan company.
[PDF] Maharaja Foods Limited - Colombo Stock Exchange
Let's examine the DCF valuation from the Maharaja Foods Limited IPO prospectus. This document shows how these calculations are presented in a real investment analysis context in Sri Lanka.
Please review two parts of this document: The Valuation Table (Table 5.2): Find this table on page 131. This is the core of the DCF. Identify the rows we've discussed: 'FREE CASH FLOW TO FIRM (FCFF)', the 'Terminal Value' listed in the last column, the 'Discount Factor', and the 'PV of FCFF'. See how they sum these to get the 'Enterprise Value' and then adjust for cash and borrowings to arrive at the 'Equity Value'. Valuation Methodology (Section 6.1): Find this on page 136. Read this short section to see the exact formulas the analysts state they used for FCFF, the discounting process, and the Terminal Value. This confirms the methods we've just learned.
This real-world example demonstrates that the concepts and formulas you've learned in this module are precisely what professionals use to value companies in the Sri Lankan market.
Conclusion
Congratulations! You have now completed the entire process of building a Discounted Cash Flow model from scratch. You've gone from forecasting a company's financials to calculating a definitive intrinsic value per share.
Key Takeaways:
- Terminal Value (TV) captures the value of a business beyond the explicit forecast period and is calculated using either the Perpetuity Growth or Exit Multiple method.
- All future cash flows (projected FCFFs and the TV) must be discounted to their present value using a discount factor derived from the WACC.
- The sum of all present values gives the Enterprise Value (EV).
- To find the Equity Value, you must adjust the EV for the company's debt and cash:
Equity Value = EV - Debt + Cash. - The Intrinsic Value per Share is the Equity Value divided by the number of shares outstanding, giving you a target price to compare against the market.
Preview of the Next Lesson:
Our DCF model produces a single number for intrinsic value. However, this number is highly dependent on the assumptions we made for the growth rate, WACC, and terminal value multiples. A small change in an assumption can lead to a big change in the valuation.
In our next and final lesson of this module, we will learn how to perform a sensitivity analysis to understand how the intrinsic value changes under different scenarios. This will help us see a range of possible values for a stock, rather than relying on just one estimate.