Introduction
Hello! In our previous lesson, we mastered the skill of calculating a company's historical Free Cash Flow to the Firm (FCFF). We learned the formula FCFF = NOPAT + D&A – Capex – ΔNWC and how to derive each component from the financial statements. This gave us a clear picture of the cash a company generated in the past.
However, a company's value comes from the cash it will generate in the future. Therefore, the next logical step in our DCF valuation journey is to forecast these cash flows.
This lesson will teach you how to project future FCFF for a company using simple growth assumptions. We will move from analyzing historical data to building a forecast, which is the heart of the DCF model. We will break down the process into a series of logical steps, starting with revenue and projecting all the other components of FCFF needed to complete our forecast.
The Forecasting Process: From Revenue to Free Cash Flow
The most reliable way to forecast FCFF is not to guess a single growth rate for the final FCFF number itself, but to build a projection for each component of the formula. This is a "bottom-up" approach that gives us more control and a better understanding of the key drivers of value.
The process typically starts by forecasting the company's revenue (the "top line") and then using assumptions to forecast expenses, investments, and ultimately, the free cash flow. This is very much like building a detailed system plan where one input drives a cascade of subsequent outputs.
The article below provides an excellent, structured guide to this process. We will walk through the key steps together.
How to Forecast Free Cash Flow to the Firm (FCFF)
Please read the following article from StableBread. It breaks down FCFF forecasting into eight clear steps. We will focus on the core forecasting steps (4 through 8).
Please read the sections from 'Step #4: Forecast Revenues' to 'Step #8: Calculate FCFF'. As you read, focus on understanding the core assumption for each step: Revenues: How is future revenue projected from historical revenue? Costs (COGS, SG&A): What is the 'percentage of revenue' method? CapEx & D&A: Why is a 'fixed assets schedule' used, and what are these items projected as a percentage of? Net Working Capital (NWC): How are items like Accounts Receivable and Inventory projected? Final Calculation: How are all these projected pieces assembled back into the FCFF formula?
As you can see from the reading, the logic is quite systematic:
- Forecast Revenue: We start by assuming a growth rate for sales. This is our primary driver. For example,
Revenue (Year 1) = Revenue (Year 0) * (1 + growth rate). - Forecast Operating Costs: We then assume that costs like Cost of Goods Sold (COGS) and Sales, General & Administrative (SG&A) will remain a stable percentage of revenue. This allows us to project our operating profit (EBIT) and, subsequently, our NOPAT.
- Forecast Investments: We must also forecast the cash needed for reinvestment.
- Capital Expenditures (Capex): The cash spent on long-term assets.
- Change in Net Working Capital (ΔNWC): The cash invested in short-term operational assets.
These are often projected based on their historical relationship with revenue or assets.
A Practical Demonstration in a Spreadsheet
Reading about the steps is one thing; seeing them in action is another. The following video provides a complete walkthrough of building an FCFF forecast in a spreadsheet, applying the very principles we just read about. Your background in data tools like Excel and Tableau will make the spreadsheet logic intuitive.
Build A Full Discounted Cash Flow Model for a REAL Company
This video from Kenji Explains, titled 'Build A Full Discounted Cash Flow Model for a REAL Company,' demonstrates how to implement these forecasting steps. We'll watch it in parts to mirror the process from the article.
Watch the following segments to see the theory put into practice: Revenue and Costs (00:39 - 02:56): See how future revenue is projected with a growth rate and how COGS and other expenses are calculated as a percentage of revenue. Capital Expenditures & D&A (03:23 - 04:35): This part shows the creation of a 'fixed assets schedule' to forecast Capex and D&A, just as described in the StableBread article. Net Working Capital (06:16 - 13:25): Watch how individual components of working capital (like accounts receivable and inventory) are projected. This is the implementation of the NWC schedule discussed in the article. Final FCFF Calculation (13:25 - 14:57): This concluding part brings all the projected components together to calculate the final Unlevered Free Cash Flow (FCFF) for each year of the forecast.
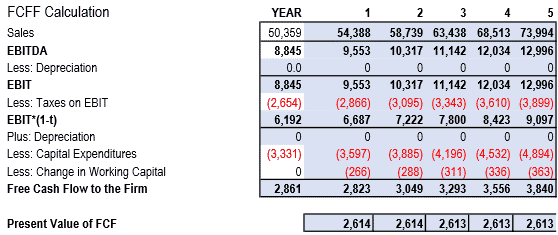
The video demonstrates a robust and detailed approach. It shows how analysts build financial models to ensure all the moving parts are connected logically. The output of this process is a table of projected FCFF for the next 5-10 years, like the one shown below.
A Simpler Formulation: Sales-Based Forecasting
While building detailed schedules is best practice, the underlying relationships can be summarized with more direct formulas. The "sales-based forecasting method" provides a more compact way to think about the projections. It formalizes the idea that investments in capital are directly related to the growth in sales.
This approach is particularly useful for quick estimates or when you don't have enough data to build full schedules.
Forecasting Free Cash Flow to the Firm (FCFF) and ...
This article from AnalystPrep provides a concise summary of the sales-based forecasting method and a clear, solved example.
Read the sections 'Forecasting FCFF and FCFE,' 'Sales-Based Forecasting Method,' and the 'Example: Forecasting FCFF.' Pay close attention to how they calculate 'Incremental FC/Sales growth' and 'Incremental WC/Sales growth.' This shows how to directly link future investment needs to future sales growth.
As you saw in the example, this method uses historical ratios to estimate how much fixed capital (Capex) and working capital will be needed for every dollar of new sales.
Incremental FC = Sales Growth * (Incremental FC / Sales growth ratio)Incremental WC = Sales Growth * (Incremental WC / Sales growth ratio)
These are then subtracted from the projected NOPAT to arrive at the FCFF. This is mathematically equivalent to the larger schedules we built, but summarized in a few key ratios.
Conclusion
In this lesson, you have taken a major step forward in your valuation journey. You've learned how to build a forecast of a company's future Free Cash Flow to the Firm, which is the engine of our DCF valuation.
Key Takeaways:
- Forecasting FCFF is done by projecting each of its components, starting with revenue growth.
- Operating costs (like COGS, SG&A) and NOPAT are typically projected as a percentage of future revenue, assuming stable profit margins.
- Reinvestments in the business (Capex and changes in NWC) are also projected based on their historical relationship with sales or assets.
- All the projected components are then combined using the formula
FCFF = NOPAT + D&A - Capex - ΔNWCto get the FCFF for each year in the forecast period.
Preview of the Next Lesson:
Our forecast currently projects cash flows for a specific period, such as the next 5 or 10 years. But a company is expected to operate and generate cash long after that. How do we capture the value of all cash flows beyond our forecast horizon? The answer lies in calculating a Terminal Value.
In the next lesson, we will learn how to calculate this terminal value and then combine it with our projected FCFFs. Finally, we will discount everything back to the present to arrive at the company's intrinsic value, completing our DCF model.