Introduction
Hello! In our last two lessons, we assembled the key components for the discount rate—the denominator of our Discounted Cash Flow (DCF) model. We learned about the Weighted Average Cost of Capital (WACC) and how to calculate its main input, the Cost of Equity, using the CAPM and beta.
Now, it's time to shift our focus to the numerator of the DCF model: the cash flows themselves. The goal of a DCF valuation is to estimate the total value of a business by projecting its future cash generation and discounting it back to today's value. But what "cash" are we talking about?
In this lesson, you will learn how to calculate a company's historical Free Cash Flow to the Firm (FCFF). This is the specific measure of cash flow that is available to all capital providers (both shareholders and lenders), making it the correct cash flow to use with the WACC. We will learn its definition, its formula, and, most importantly, how to derive it directly from a company's financial statements.
What is Free Cash Flow to the Firm (FCFF)?
Before we start calculating, it's crucial to understand what FCFF represents conceptually. Think of it as the total cash profit a company's core business operations generate in a year, after accounting for the necessary investments in its long-term assets (like machinery) and short-term assets (like inventory) needed to sustain its operations.
This cash is "free" because it's what's left over for the company to distribute to its investors—both lenders (as interest and principal payments) and owners (as dividends or buybacks)—without disrupting its operations. Because it represents cash flow before any payments to lenders, it is considered "unlevered" and is independent of the company's financing decisions.
To get a clear overview, please watch the first part of the following video.
The video 'Free Cash Flow' from Edspira provides a concise and clear definition of FCFF, explaining who has a claim on this cash and why we calculate it before any financing decisions.
Please watch from the beginning until 02:33. Focus on understanding that FCFF is the cash flow left over before it's distributed to lenders and owners.
The Formula for Calculating FCFF
The most common and intuitive way to calculate FCFF starts with a company's operating profit. The standard formula is:
Where:
- NOPAT is the Net Operating Profit After Tax.
- D&A is Depreciation and Amortization.
- Capex is Capital Expenditures.
- ΔNWC is the Change in Net Working Capital.
Let's break down each component. We'll use this formula as our foundation for the rest of the lesson.
To understand each component of the FCFF formula in detail, please read the following article from WallStreetPrep. It provides clear explanations for each term.
Read the section titled 'FCFF Formula'. It breaks down how to calculate NOPAT and explains the role of D&A, the Change in NWC, and Capex.
Here is a summary of the components and why they are included:
-
NOPAT (Net Operating Profit After Tax):
- This is our starting point. It's calculated as
EBIT × (1 – Tax Rate). - EBIT (Earnings Before Interest and Taxes) is found on the Income Statement. It represents the company's core operational profitability before financing costs (interest) are considered.
- We tax EBIT directly to see what the tax bill would have been if the company had no debt. This makes NOPAT a capital-structure-neutral measure of profit, which is exactly what we need for FCFF.
- This is our starting point. It's calculated as
-
+ Depreciation & Amortization (D&A):
- D&A is an expense on the Income Statement that reduces reported profit, but it is not an actual cash outflow. The company doesn't write a cheque for "depreciation."
- Since it was subtracted to get to EBIT, we must add it back to get a true picture of the cash generated.
-
– Capital Expenditures (Capex):
- This represents the cash spent on purchasing or upgrading long-term assets like buildings, machinery, and equipment (Property, Plant & Equipment or PP&E).
- This is a real cash outflow necessary for maintaining and growing the business. You can typically find this figure in the Cash Flow Statement under "Cash Flow from Investing Activities."
-
– Change in Net Working Capital (ΔNWC):
- Net Working Capital (NWC) is the cash tied up in the daily operations of a business. It's usually calculated as:
(Accounts Receivable + Inventory) – Accounts Payable. - When NWC increases from one year to the next, it means the company used more cash than it generated from its operations (e.g., by selling more on credit or holding more inventory). This use of cash must be subtracted.
- Conversely, if NWC decreases, it freed up cash, which would be added to FCFF.
- Net Working Capital (NWC) is the cash tied up in the daily operations of a business. It's usually calculated as:
This process is a lot like an engineering workflow: you're pulling specific data points from various sources (the financial statements), making defined adjustments, and processing them through a formula to arrive at a final, meaningful metric.
A Practical Walkthrough: Calculating FCFF from Financial Statements
Now let's apply this theory. The best way to learn is by doing. The following video provides an excellent, detailed walkthrough of calculating FCFF using a hypothetical company's full set of financial statements.
CFA Level 2 | Equity Valuation: Calculating FCFF and FCFE from Financial Statements
The video 'CFA Level 2 | Equity Valuation: Calculating FCFF and FCFE from Financial Statements' by Fabian Moa is a detailed tutorial. We will use it to see exactly where each number in the FCFF formula comes from.
We will watch this in a few steps. First, watch from the beginning to 03:15 to familiarize yourself with the example Income Statement and Balance Sheet we'll be using. Next, jump to the section from 13:07 to 14:04. This part specifically calculates FCFF using the NOPAT-based formula we just learned. You can also review the segment from 05:58 to 10:26, which explains in detail how to find Capex and the Change in Net Working Capital from the statements. This is useful for deeper understanding.
Let's reconstruct the calculation shown in the video at timestamp 13:07.
Formula: FCFF = EBIT × (1 – T) + D&A – Capex – ΔNWC
- EBIT: From the Income Statement, EBIT is $750 million.
- Tax Rate (T): The company's tax rate is given as 40%.
- NOPAT:
750 × (1 - 0.40) = 750 × 0.60 = $450 million. - D&A: From the Income Statement, Depreciation is $250 million.
- Capex: As explained around timestamp 06:10, this is the change in Gross PP&E from the Balance Sheet.
Gross PPE (2019) - Gross PPE (2018) = 3,600 - 3,100 = $500 million. This represents the new equipment purchased. - ΔNWC: This is the most complex part. As calculated between 09:31 and 10:26, we look at the change in the operating working capital accounts on the Balance Sheet.
Working Capital (2019) = (AR 690 + Inv 450) - (AP 250 + Accrued Exp 140) = 1140 - 390 = 750Working Capital (2018) = (AR 630 + Inv 380) - (AP 230 + Accrued Exp 100) = 1010 - 330 = 680ΔNWC = 750 - 680 = $70 million. This increase represents a use of cash.
Now, we plug everything into our formula:
This result of $130 million is the free cash flow generated by the firm in 2019. This is the historical cash flow figure we would use as the base for our DCF projections.
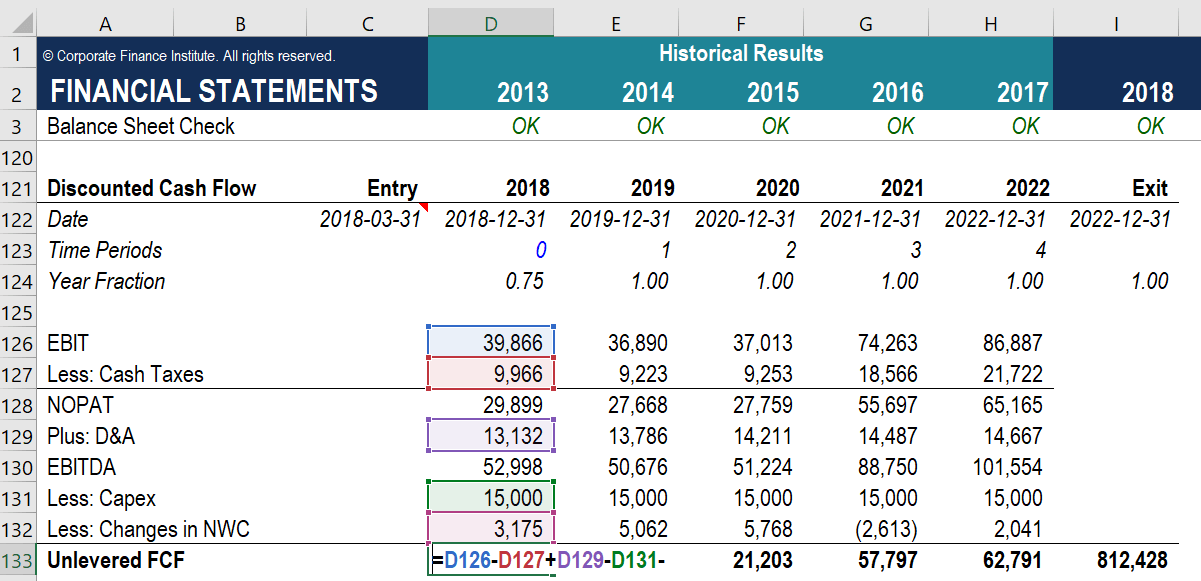
In practice, analysts build spreadsheets to perform these calculations over multiple years, as shown in the image below.
Alternative Calculation Methods
As the video and articles mention, there are other formulas to calculate FCFF, which start from different points in the financial statements. While they look different, they will always yield the same result if applied correctly.
-
Starting from Net Income (NI):
Here, you start with Net Income, add back D&A, and also add back the after-tax interest expense. This is because interest was subtracted to get NI, and we need to reverse that to get back to an unlevered (firm-level) cash flow.
-
Starting from Cash Flow from Operations (CFO):
This is often the quickest method. CFO (from the Cash Flow Statement) already includes NI, D&A, and ΔNWC. So, you just need to add back the after-tax interest and subtract Capex (which is from the Investing section, not the Operations section).
Understanding all three methods will make you a more versatile analyst.
Free Cash Flow to the Firm (FCFF)
For a second worked example and a great summary of the formulas, you can review the 'Practical Example' in the article from 365 Financial Analyst.
Read the sections 'How Do You Calculate FCFF?' and 'Practical Example'. The example uses the NI-based formula and clearly shows how to derive Capex and Working Capital Investment from the provided Balance Sheet.
Conclusion
Today, we've moved from the abstract concept of "cash flow" to a concrete, calculable number: Free Cash Flow to the Firm. This is the engine of value for any company and the cornerstone of our DCF model. By learning to calculate it from the financial statements, you have gained a fundamental skill in financial analysis.
Key Takeaways:
- FCFF is the cash generated by a company's core operations that is available to all capital providers (lenders and shareholders).
- It is calculated after accounting for reinvestments in the business (Capex and NWC) but before payments related to financing (interest).
- The most common formula starts with operating profit:
FCFF = NOPAT + D&A – Capex – ΔNWC. - Each component of the formula can be found or derived from the three main financial statements: the Income Statement, Balance Sheet, and Cash Flow Statement.
Preview of the Next Lesson:
Calculating historical FCFF is the first step. To value a company, however, we need to estimate its future FCFF. In our next lesson, we will learn how to use the historical data we just calculated as a base to project future FCFF using simple growth assumptions, bringing us one step closer to completing our DCF valuation.